
Market Monitor March 3
By Kristoff De Turck - reviewed by Aldwin Keppens
Last update: Mar 4, 2025
Market Sell-Off: SPY, QQQ, and IWM Face Sharp Declines Amid Tech Weakness and Tariff Fears
Monday, March 3, was a tough day for U.S. markets, with the S&P 500 recording its worst drop of 2025.
Investors reacted nervously to former President Donald Trump’s confirmation of import tariffs and disappointing U.S. economic data. Tech stocks, particularly Nvidia, took heavy hits.
S&P 500 Sees Worst Day of the Year
The U.S. stock markets started the trading day positively, but sentiment quickly turned sour. The Dow Jones (DIA) closed 1.5% lower, the Nasdaq (QQQ) lost 2.6%, and the S&P 500 (SPY) dropped 1.8% to 5,849.72 points, marking its worst day of 2025.
Two key developments pressured the markets. First, after a month-long delay, Donald Trump announced the implementation of import tariffs on goods from Canada and Mexico. Starting Tuesday, 25% tariffs will apply to Canadian and Mexican imports, along with an additional 10% tariff on Chinese goods. This fueled fears of retaliatory measures and further disruptions in global supply chains.
Additionally, economic data provided little optimism. The ISM manufacturing index fell from 50.9 to 50.3 points, signaling a slowdown in growth. The numbers reinforced concerns about stagflation, a combination of high inflation and slowing economic growth. At the same time, construction spending unexpectedly declined by 0.2%, while economists had forecasted a slight increase.
Tech Sector Under Pressure: Nvidia Plummets
Technology stocks suffered the most, with Nvidia (NVDA) leading the losses. The chip giant’s stock plunged 8.7% after news emerged that Singapore is investigating the smuggling of Nvidia’s advanced AI chips into China. Despite export restrictions, the chips may have reached China via Malaysia, raising concerns about stricter enforcement by the U.S. government.
Other big-tech stocks also saw declines. Investors have been gradually reducing their exposure to the tech sector and shifting focus to other industries.
Analysts suggest that such sector rotations are a natural part of a bull market and not necessarily a reason for panic.
Falling Bond Yields and Oil Prices
Ongoing geopolitical tensions led investors to seek safer assets, resulting in a decline in bond yields. The U.S. 10-year yield fell by 7 basis points to 4.153%, while the 2-year yield dropped by 4 basis points to 3.948%.
Oil prices also declined. The April crude oil futures contract fell by $1.39 (1.99%) to $68.37 per barrel.
Company-Specific News
Nvidia (-8.7%) (NVDA)
The chipmaker took a major hit due to concerns over export restrictions and the potential consequences of stricter enforcement.
Tesla (-2.8%) (TSLA)
The EV maker’s stock remained under pressure after experiencing one of its worst months ever (-25% in February). CEO Elon Musk remains optimistic, predicting a 1,000% profit increase over the next five years.
Chinese EV Makers
The U.S.-listed shares of Nio (NIO), XPeng (XPENG), and Li Auto (LI) dropped between 5.7% and 10.9%.
Crypto-Related Companies
MicroStrategy (MSTR) (-1.8%), Coinbase (-4.6%) (COIN), and Robinhood (-6.4%) (HOOD) closed lower despite Trump’s positive statements about crypto.
Chipotle (+0.7%) (CMG)
The fast-food chain gained following an upbeat analyst report from Morgan Stanley.
Kroger (-2.9%) (KR)
The supermarket chain declined after news broke that CEO Rodney McMullen will step down following a misconduct investigation.
Outlook
Investors remain cautious ahead of upcoming economic updates, including Friday’s monthly jobs report. The impact of new tariffs and potential countermeasures will play a key role in shaping market sentiment in the coming weeks. Despite the sharp correction in the tech sector, analysts still see opportunities in emerging industries, which could produce new market leaders in the near future.
Daily Market Analysis – March 03, 2025 (After Market Close)
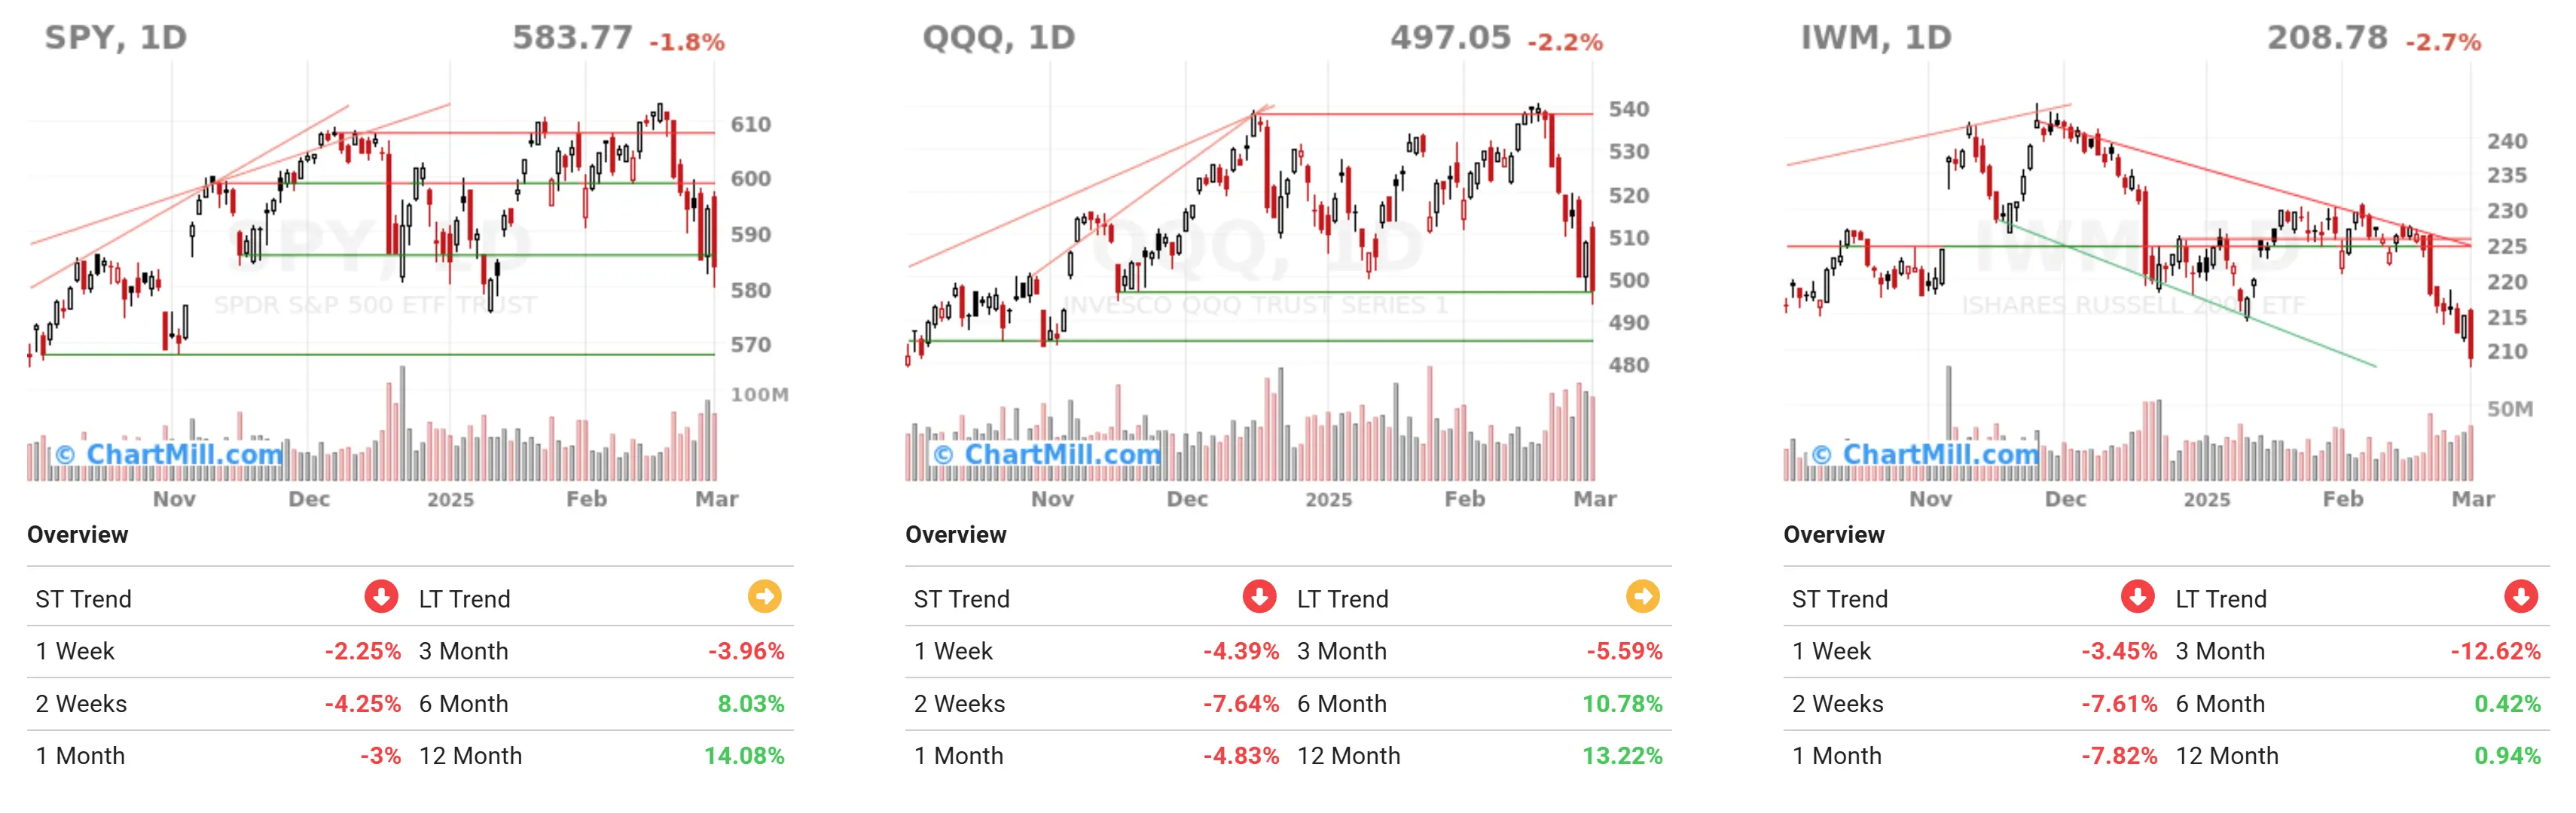
SPY (S&P 500 ETF)
-
Current Price: 583.77 (-1.8%)
-
Short-Term Trend (ST Trend): Negative
-
Long-Term Trend (LT Trend): Neutral
Technical Observations:
-
SPY has experienced a strong decline and has fallen below recent support levels.
-
The 1.8% drop on Monday, March 3, was significant, confirming short-term weakness.
-
Over 1-week and 2-week periods, it has declined by -2.25% and -4.25%, respectively.
-
The 12-month trend remains positive with a 14.08% gain.
QQQ (Nasdaq-100 ETF)
-
Current Price: 497.05 (-2.2%)
-
Short-Term Trend (ST Trend): Negative
-
Long-Term Trend (LT Trend): Neutral
Technical Observations:
-
QQQ lost 2.2% on the day and has dropped below a key support zone.
-
1-week and 2-week declines are steeper than SPY: -4.93% and -7.66%.
-
The Nasdaq-100 is struggling more than the S&P 500, mainly due to weakness in tech stocks, particularly Nvidia (-8.6%).
IWM (Russell 2000 ETF)
-
Current Price: 208.78 (-2.7%)
-
Short-Term Trend (ST Trend): Negative
-
Long-Term Trend (LT Trend): Negative
Technical Observations:
-
Russell 2000 ETF showed the weakest performance, falling 2.7% on Monday, March 3.
-
1-week, 2-week, and 3-month declines are -3.45%, -7.61%, and -12.62%, respectively.
-
The long-term trend is negative, and continued declines suggest a potential breakdown to new lows.
-
Small caps continue to underperform compared to large-cap indices, signaling broader market weakness.
Sector Analysis
-
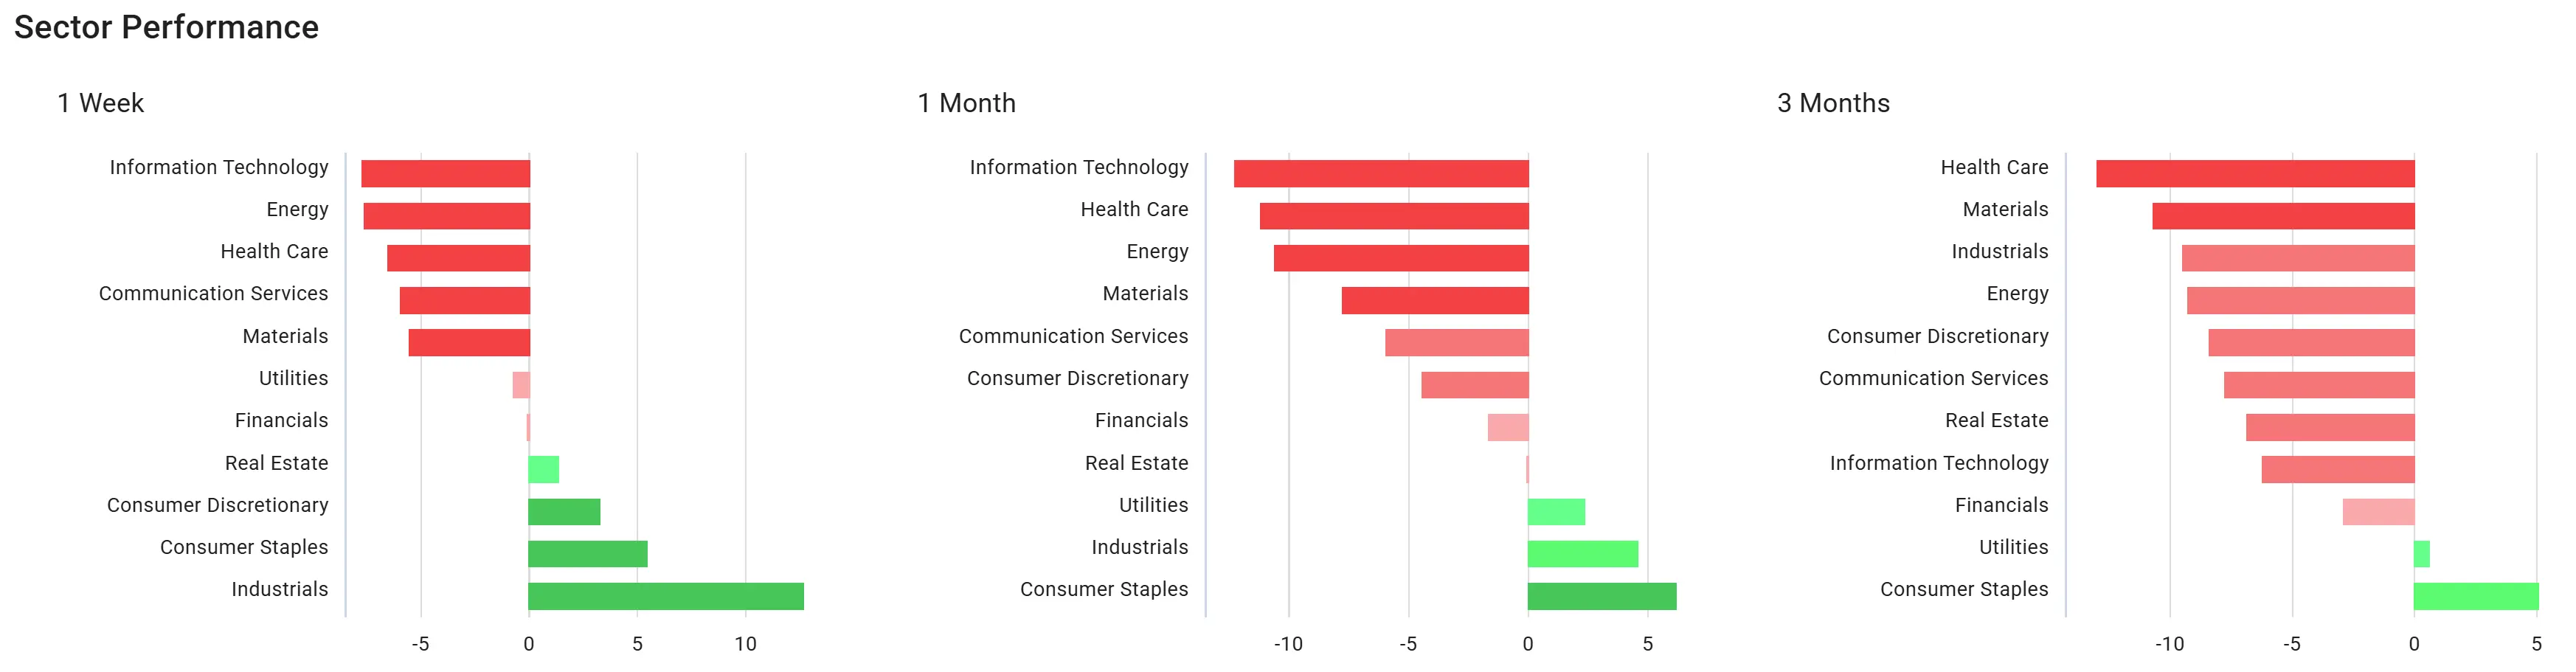
Weakest Sectors (1W & 1M): Information Technology, Energy, Healthcare.
-
Strongest Sector (1W & 1M): Industrials, Consumer Stapels
Sector Conclusion:
Tech stocks took the hardest hit in the past week, aligning with QQQ’s sharp drop. Over the past month and three months, most sectors have been trending downward, except for some defensive sectors like Utilities and Consumer Staples, which have held up relatively better.
Market Breadth Analysis
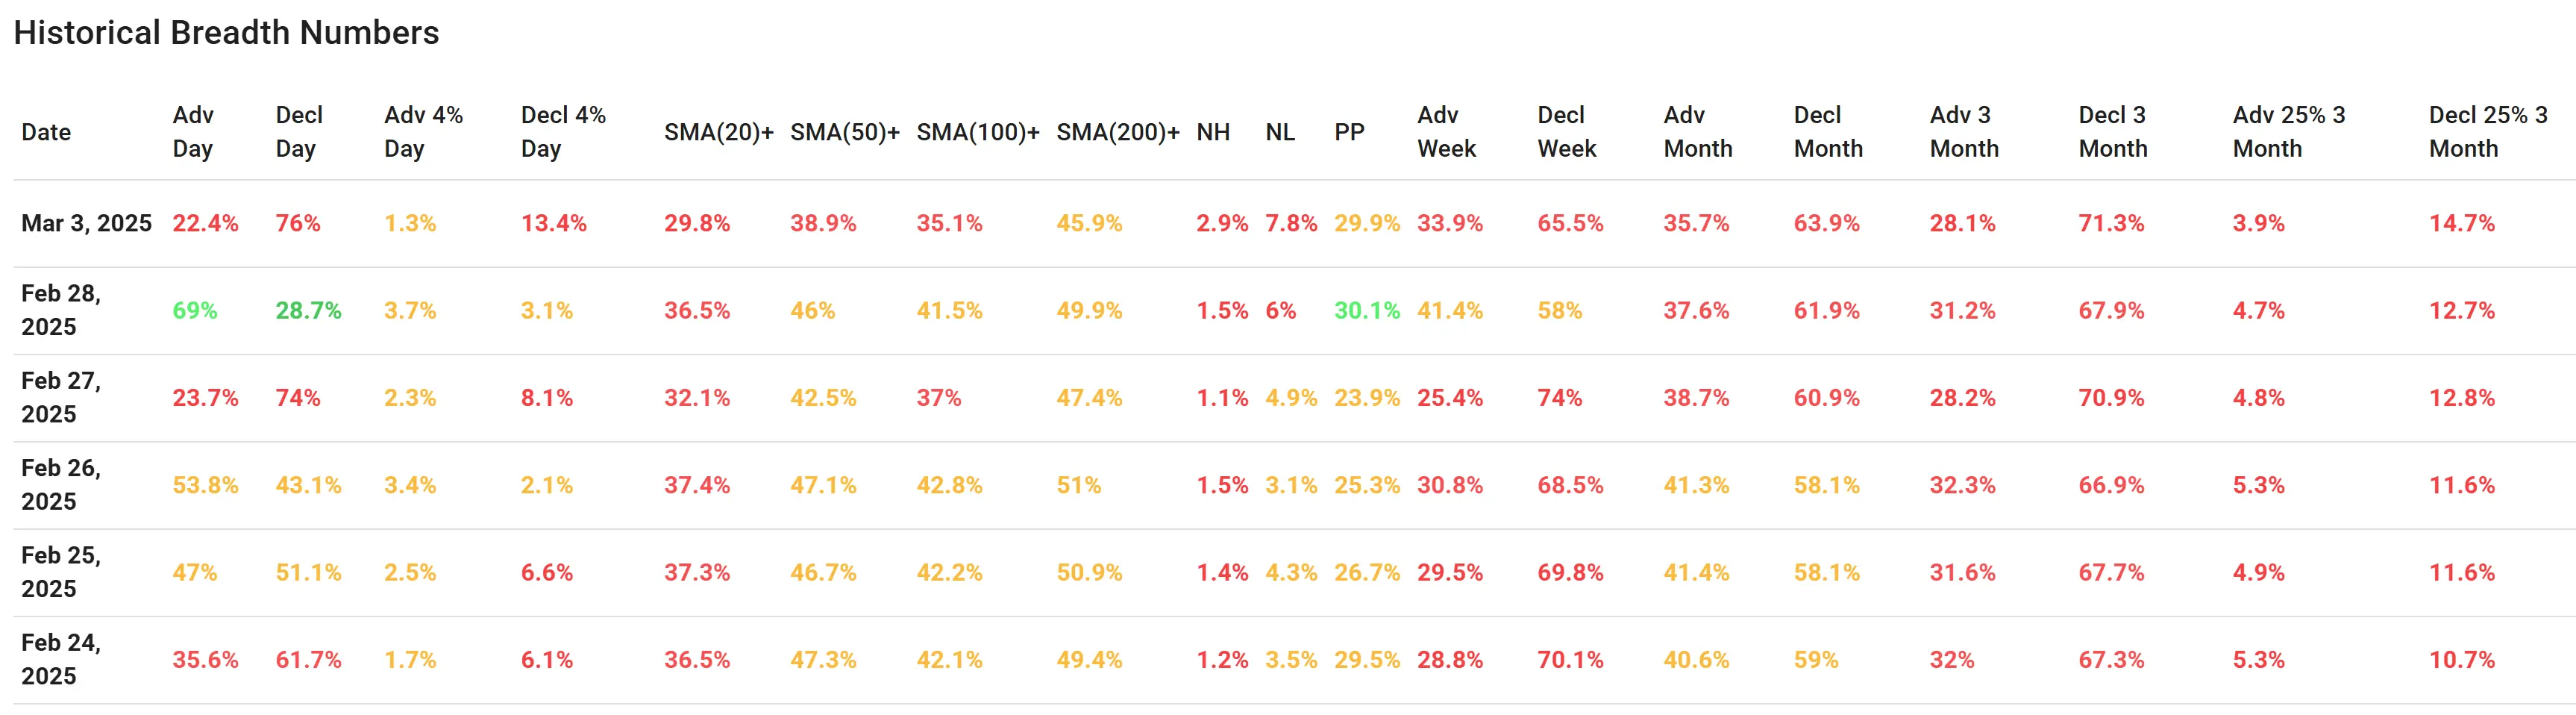
Data from March 3, 2025 (Latest Trading Day)
-
Advancing Stocks (Adv Day): 22.4% (very low)
-
Declining Stocks (Decl Day): 76% (very high)
-
SMA(20+): 13.4% (very weak momentum)
-
SMA(50+): 29.8% (slight decline, confirming weakness)
-
SMA(100+): 35.1%
-
SMA(200+): 45.9% (long-term trend not fully bearish, but weakening)
-
NH/NL (New Highs/New Lows): More new lows than new highs.
Comparison with the Previous Week (Feb 28 - Feb 25)
-
On February 28, Adv Day was still 29.7%, higher than on March 3.
-
On February 27, Adv Day was 23.7%, still weak but better than March 3.
-
On February 26 and February 25, Adv Day was above 50%, indicating a much healthier market at that time.
-
Over the past week, the percentage of declining stocks increased, while advancing stocks decreased, confirming deteriorating market conditions.
Market Breadth Conclusion:
Market breadth has significantly weakened over the past week. With only 22.4% advancing stocks and 76% declining stocks on March 3, the negative breadth is evident. This suggests that the decline is not limited to a few large stocks but is widespread. The weak percentage of stocks above their SMA(20), SMA(50), and SMA(100) confirms the overall market weakness.
Overall Conclusion
The U.S. stock markets have undergone a significant correction, particularly in technology and growth stocks. The downward movements in SPY, QQQ, and IWM indicate broad market weakness, with IWM being the weakest index. Sector analysis confirms that the correction is widespread, with technology suffering the most. Defensive sectors are offering some protection, but the overall market remains weak. The market breadth analysis shows that the decline is not limited to a few stocks but reflects a broad-based sell-off.
In the short term, caution is warranted, as market weakness is becoming more pronounced. The coming days will be crucial in determining whether support levels hold or if further selling pressure drives indices lower.
5.03
+0.04 (+0.8%)
62.1
-0.56 (-0.89%)
35.66
-0.28 (-0.78%)
167.5
+5.42 (+3.34%)
177.72
+1.43 (+0.81%)
489.88
+14.57 (+3.07%)
16.68
+0.04 (+0.24%)
18.47
+0.16 (+0.87%)
252.61
+2.19 (+0.87%)
119.4
+4.14 (+3.59%)
Find more stocks in the Stock Screener
NIO Latest News and Analysis

