Stan Weinstein stage analysis in chartmill
Weinstein stage analysis in the ChartMill charts and screener
Scan the market with advanced technical analysis filters built for active traders.
ChartMill’s technical stock screener helps swing and day traders filter stocks using chart patterns, trend indicators, volume spikes and momentum signals.
Identify breakout setups, short-term pullbacks and high-probability trading opportunities in seconds.

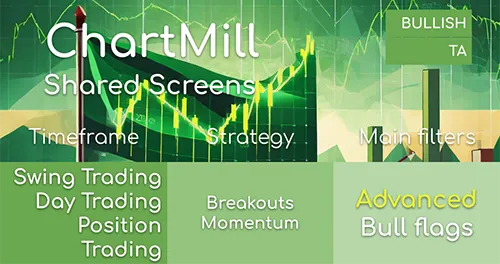
Explore pre-built swing trading screens inside our technical stock screener. Discover breakout setups, pullback opportunities and momentum-based trading ideas used by active traders.
Learn how to identify high-probability breakout trading setups using technical analysis. This in-depth guide explains the strategy and shows how to scan for breakouts with ChartMill.
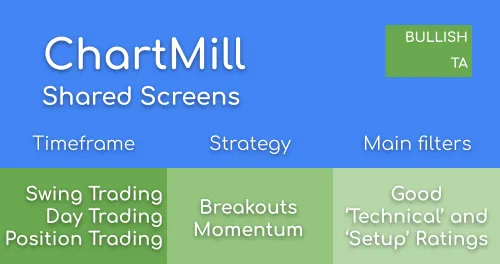
Use our popular breakout stock screener to find explosive price moves across day, swing and position trades. Powered by proprietary Technical Analysis and Setup Ratings.
ChartMill combines a powerful technical stock screener with advanced charting, watchlists and risk management tools.
Scan for breakout and pullback setups, analyze multiple charts on one page, organize opportunities into watchlists and manage risk with our built-in position sizing tool.

Use our technical stock screener to quickly scan the market for breakout and pullback setups.
Filter stocks using Relative Strength, Performance, Moving Averages, ChartMill Ratings and advanced pattern detection tools to identify the strongest technical setups.
View results as charts to scan dozens of stocks in minutes and spot consolidations, trend reversals and high-probability entries.

Customize how you analyze stock screener results with a wide range of pre-configured views.
Switch between table, column and chart views showing the technical or fundamental metrics that matter most to your strategy.
Create your own custom screener views to display exactly the data and charts you need for faster decision making.

Analyze price action with interactive stock charts featuring automated support and resistance detection and a wide range of technical indicators.
Use full-screen charts, custom annotations and integrated position sizing tools to fine-tune your technical analysis.

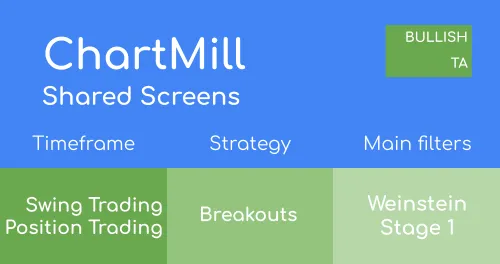
Access a large library of pre-configured stock screens based on well-known trading books and proven systems.
Combine technical and fundamental filters to build swing trading, growth investing or position trading strategies — and fine-tune them to match your own approach.

Every stock includes a daily updated technical analysis report covering short- and long-term trends, relative performance, support and resistance zones, and chart and candlestick patterns.
Our Technical Rating summarizes overall strength, while the Setup Rating identifies consolidation patterns and potential entry points.

Go beyond basic indicators with advanced technical metrics including:

We want you to be successful with ChartMill. Explore our growing library of articles, videos and blog posts to sharpen your technical trading skills.
Our founders each have more than 20 years of market experience and are always available to help.

Monitor overall market conditions with our market breadth tools and 10 years of historical data. Identify the strongest sectors and industries to align your trades with market momentum.
Explore technical trading articles, breakout screens and educational videos to help you find and refine high-probability swing and day trading setups.
Weinstein stage analysis in the ChartMill charts and screener

Mansfield Relative Strength as used by Stan Weinstein
A Chartmill Channel is a horizontal channel wherein prices move sideways

Finding narrow trading ranges with ChartMill Channels

Weinstein’s phase model superposed with a quantified system dynamics model

An in depth reading on ChartMill Channels

Some general pointers on trading, setups, position sizing and money management.

Based on one of the setups used by Swedish swing trader Kristjan Kullamägi, this continuation breakout screen looks for stocks that have risen sharply over a relatively short period, followed by an orderly pullback and consolation.

The qullamaggie episodic pivot setup is a highly effective strategy for identifying stocks with significant upward momentum following a major catalyst.

Find consolidations based on the Bollinger Band Squeeze criteria by using the Keltner Channels
Tsunami Setups or Squeeze Play Setups can lead to great breakouts

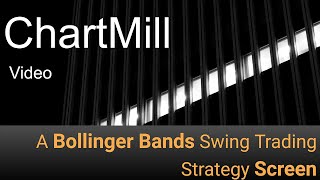
Momentum Squeeze Plays find consolidations after a strong move up, using the Bollinger Bands.

Bollinger Bands® is a dynamic indicator designed to measure volatility. It consists of three lines. A middle, upper, and lower band. The middle band is a simple moving average (SMA), set at 20 periods by default. The outer lines are standard deviations, representing the degree of price dispersion around that middle band.
View the technical health and setup quality of any stock with these ChartMill ratings.

The Technical Breakout Setups screen finds consolidations in strong stocks in the market
Finding Breakout Setups for Swing Trading using the ChartMill Screening Filters.

Explore the fundamentals of breakout trading in this informative article. Understand what breakout trading is, how to spot potential breakouts, and the key factors that make this strategy popular among traders.
The Stock Screener supports different support and resistance trading strategies. Some examples are listed in this article.

Learn how to find horizontal bases after a strong uptrend by using ChartMill Channels
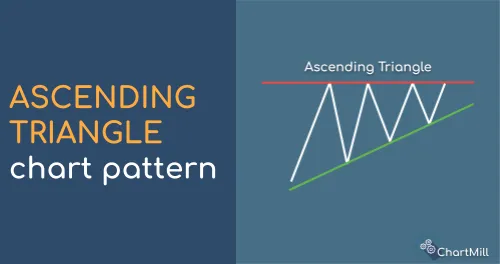
An ascending triangle is a bullish continuation chart pattern that forms when there is a strong upward trend in the price of an asset. It is characterized by a series of higher lows and a horizontal resistance area.
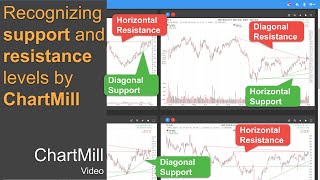
Learn how to find support and resistance levels using technical analysis tools, such as horizontal and diagonal trend lines, moving averages, and Fibonacci retracements.
There is no one best support and resistance indicator, but combining several technical indicators provides more confidence. Moving averages, Bollinger Bands, Fibonacci retracements, and pivot points can serve as dynamic support and resistance zones. Relative Strength Index (RSI) can be used as a confirmation signal.
Consolidated Support and Resistance combine support and resistance from several indicators and time frames
Learn when to enter a breakout trade in 4 different ways, each with its own advantages and disadvantages. Whether you're buying before, during, or after the breakout or waiting for a retest, identifying key levels and monitoring momentum are essential.
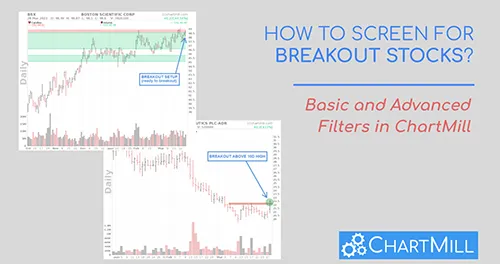
Discover how to screen for breakout stocks or stock that are on the verge of doing so. Take advantage of specific price and volume filters and very sophisticated fully automated support and resistance recognition by ChartMill.

The opening range is formed between the highest and lowest price, immediately at market opening, up to a maximum of one hour after the opening. The opening range breakout strategy involves entering a long or short position as soon as the price breaks the initial opening range up or down.
This Bull Flag Trading guide explains how to take advantage of the pattern, both as a swing and day trader.

Discover the bull flag chart pattern—a continuation pattern signaling strong uptrends. Learn how to identify and trade this setup with practical examples and expert tips.
Discover the High Tight Flag pattern – one of the most powerful breakout setups in technical analysis. Learn how to identify, trade, and maximize gains from this rare but explosive chart pattern.

Discover the best indicators for swing trading. Enhance your setups, maximize profits, and seize opportunities with effective strategies. Elevate your trading game today!

Swing trading is an active trading strategy where positions are held for one to several days or weeks. The trader tries to anticipate, and profit from, a future price trend. It is used by traders in various financial markets, including stocks, forex, and commodities.
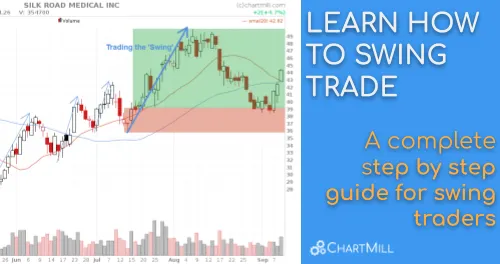
This comprehensive guide is an extension of our basic "what is swing trading" article and contains a lot of valuable information and insights for beginning swing traders, specifically designed to: - teach you the basic principles and conditions which are typical of this type of trading, - quickly get you started with this trading strategy, - recognize expensive beginner's mistakes early on and know how to avoid them!
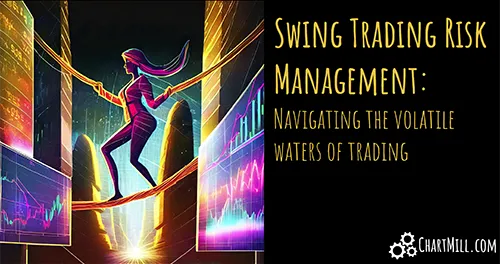
In this article, we highlight some decent swing trading risk management practices to minimize your risk, so that your trading capital enjoys maximum protection.

The Best Moving Averages for Swing Trading. Learn how to combine short-term and long-term MAs for successful trades in this comprehensive guide.
From the popular book by Stan Weinstein 'Secrets for profiting in Bull and Bear markets', using the chartmill Weinstein indicators.
This screen finds stocks that have a long upper weekly chartmill channel. The stock is currently trading near the upper channel line. The channel line acts as resistance, when the stocks breaks this resistance a possible strong move may follow.
This screen finds stocks that are nearing a long lower chartmill channel line that acts as support. This screen finds short setups: when the channel is broken, a possible strong move down may follow.

Using chartmill channels in combination with trend intensity can find some nice horizontal basing patterns.
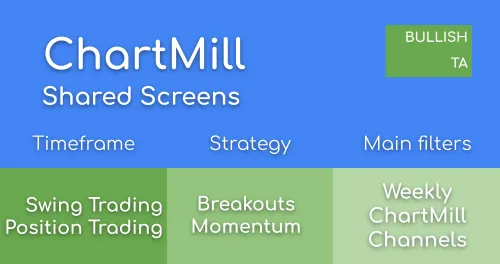
Find strong stocks in the market that are in a narrow trading range. We use Chartmill Channels to determine the trading range. By using the Chartmill Technical Quality Score we make sure to select stocks that are in an uptrend and technically solid.
This screen looks for stocks that have risen sharply over a relatively short period, followed by an orderly pullback and consolation.
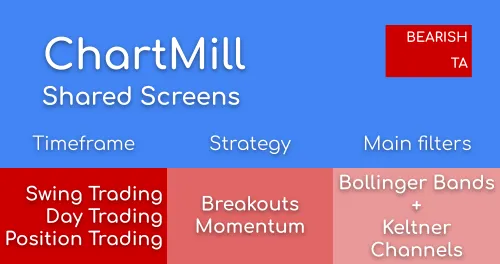
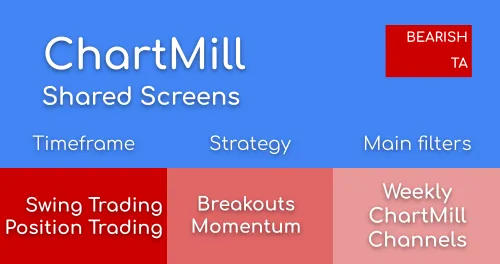
Squeeze plays indicate a narrow range. This screen additionally filters for a short term downtrend, listing short opportunities
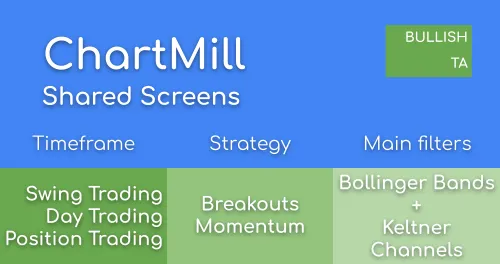
This screen finds squeeze play setups on stocks that are in a strong uptrend. A squeeze play setup occurs when the Bollinger Bands are inside the Keltner channels. When this happens, the stock has been trading in a narrow range for a while. A major move could happen when the stock breaks out of this trading range.
The Technical Breakout Setups will filter for stocks with a good Technical Rating and a good Setup Rating, leading to a list of breakout setups in the best performing stocks in the market.
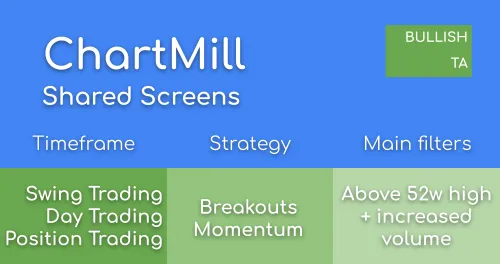
This screen looks for stocks breaking out above their highest annual price with increased volume.

This screen finds stocks approaching a strong support line and where there may be opportunities to buy the stock.
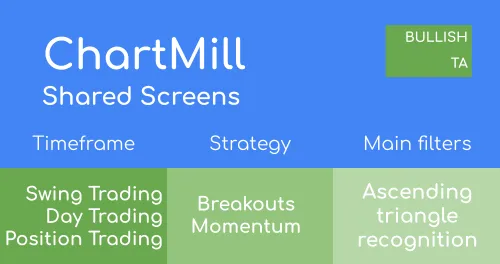
An Ascending Triangle Pattern is a bullish pattern and is formed when the price is trapped between horizontal resistance above and an upwards support trendline.

A Descending Triangle Pattern is a bearish pattern which has horizontal support and a descending resistance line.

The Symmetrical Triangle Pattern can be considered both Bullish and Bearish and occurs when price is trapped between a declining resistance line and a rising support line.
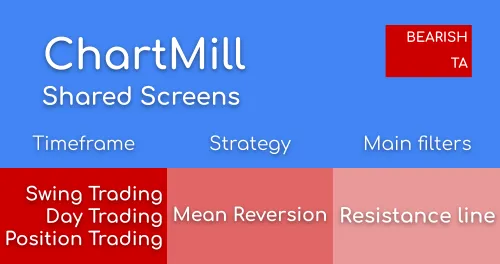
This screen finds stocks approaching a strong resistance line where there may be opportunities to short the stock.

This screen finds strong stocks near a new high. This list allows you to find stocks 'about to make a new high'. Good bases still need to be found either by further filtering or by manual inspection.
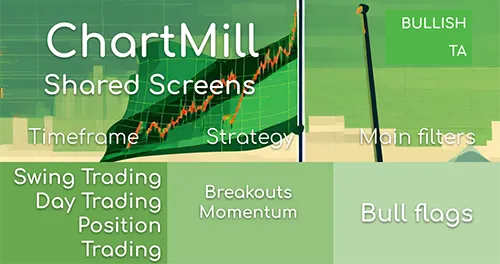
This screen finds bull flag patterns. A bull flag is a technical continuation pattern which can be observed in stocks with strong uptrends. The pattern takes shape when the stock retraces by going sideways (or by slowly declining) after an initial big rise in price. When you see the graphical representation of this pattern, you’ll notice that it somehow looks like a flag on a pole.
Only stocks in bullish trend, showing strong price run-up, decent relative strength and diminishing volume in the flag itself.
This screen uses the Bollinger Bands indicator more specifically the lower bollinger band. To define the relationship between price and the lower bollinger band, two custom filter were used
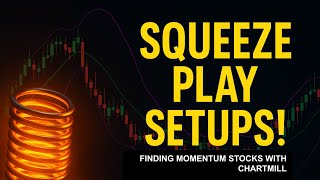
In this video, I’ll show you how to find Squeeze Play Setups using the ChartMill stock screener. These setups occur when Bollinger Bands tighten inside Keltner Channels, signaling a period of low volatility, often followed by powerful breakouts.
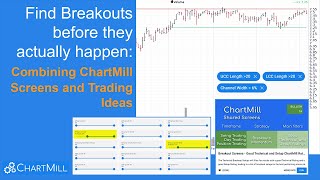
Learn how to combine ChartMill Screens and Trading Ideas to find those low-risk breakout trading setups.
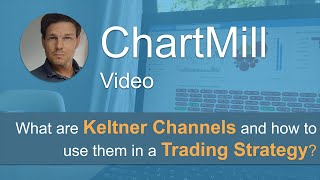
A keltner channel is a trend following indicator that identifies when a trend is losing momentum but it can also be used to define long or short entry signals. In this video I describe two different ways the Keltner channel can be used in a trading strategy.

Finding stocks that are about to break out can be done in many different ways in ChartMill. In this video I show one quick, easy and very efficient way to find great swing trading setups in just a few clicks using ChartMill.

Discover the 5 most effective momentum-stock screens you can run in ChartMill right now! Whether you're a swing trader, breakout trader, or momentum-focused day trader, these fast and simple screens will help you quickly identify stocks with strong upside potential.
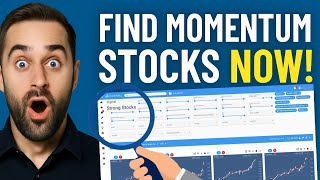
Want to find strong momentum stocks in minutes? In this video, we’ll show you step-by-step how to use the ChartMill Stock Screener to quickly identify stocks with powerful trends, strong relative strength, and rising trading volume.
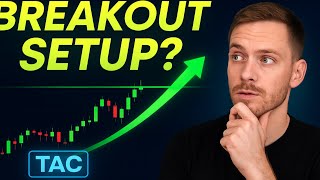
In this video, I’ll walk you through the exact filters I used to find Transalta Corp (TAC) and explain why this setup could be interesting for both swing and day traders. From sector strength to volume spikes, here’s everything you need to know before taking a trade.
In this video I'll go through my entire ChartMill workflow to obtain a list of stocks which have just broken out above their existing high and trading range. These are ideal Breakout Setups to trade.
Did you know that the stock screener ChartMill is capable of automatically recognizing support and resistance levels? Even more so! You can use specific support and resistance filters to screen stocks based on their proximity to their next support or resistance zone and thus discover great swing trading setups!
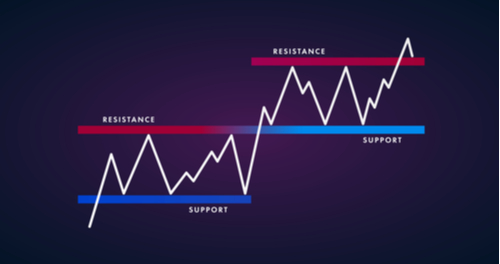
Support and resistance are technical price levels that are important for investors whose strategy is based on technical analysis and price action. However, fundamental investors can certainly benefit from these price levels as well. After all, these are specific price zones that are watched by a lot of buyers and sellers and where there is a lot of price action. That allows for better timing of entries and a better delineation of risk.
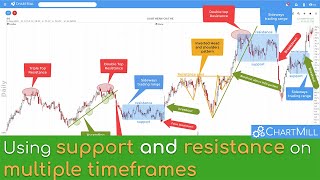
Support and resistance levels are without a doubt the most important parameters in technical analysis. These are specific price levels where a significant price bottom or price top was formed in the past on multiple time frames. And it is precisely because of that existing top or bottom that technical traders assume that that particular price level will once again become a key level for supply and demand when price hits it again.
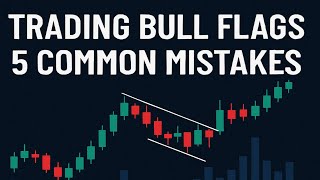
Are you struggling to trade bull flag patterns successfully? In this video, we break down the 5 most common mistakes traders make when trading bull flags — and how you can avoid them to improve your results.
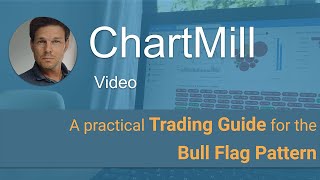
In depth explanation of the bullish flag pattern
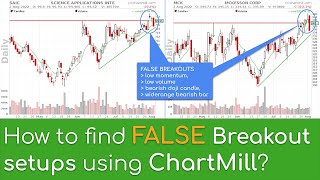
Trading price breakouts is a well-known technique from technical analysis which is mainly used by price action traders. The breakout strategy can be very profitable if you manage to focus only on the very best setups. But the same is true if you now how to short breakoutsetups that fail... In this video i use the ChartMill stock screener to find those failed breakoutsetups and i will provide some tips about the entry conditions.
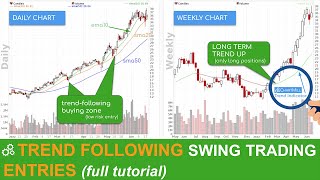
WHY TREND FOLLOWING? Typical trend investors have only three consecutive goals in mind: 1. Identify new potential long-term trends 2. Stay invested in clear strong trends as long as possible 3. Close positions as quickly as possible when it is clear that the trend has ended. Thus, the purpose of a Trend Following Swing Trading Strategy is not to predict tops or bottoms. The typical trend trader will try to identify the main trend before taking a position and then open a position in the direction of that prevailing trend in order to maximize potential profits. In this video we take a look at some trend following entry techniques.
A highly effective ChartMill filterscreen to find low risk/high reward long- and short setups, using the Bollinger Bands indicator. This screen can be used on different timeframes.