Bullish Engulfing Pattern in Strong Stocks
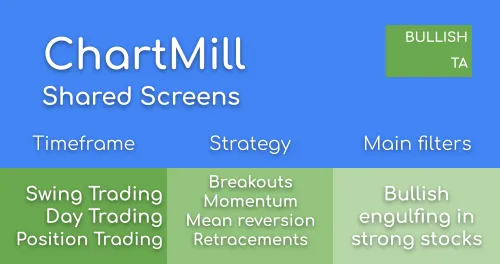
Consistent strong performing stocks that show a bullish engulfing pattern
Strong Stocks
Strong stocks are consistent strong performers in the market
Bullish Engulfing: Powerful Candlestick for Trend Reversals
Learn everything about the Bullish Engulfing Pattern, a powerful candlestick signal indicating potential trend reversals. Discover how to identify and use this pattern in your trading strategy effectively.
Related Videos

Bullish Engulfing Candlestick in Technical Analysis
The Bullish Engulfing candlestick is a bullish reversal candlestick pattern at the bottom of a downtrend. This specific pattern consists of two candles where the second bullish candle completely envelops the body of the first bearish candle as a sign of bullish momentum. Looking for a detailed guide with examples? Read our detailed article on the Bullish Engulfing pattern in the Related Articles section below.
5 momentum screening ideas using ChartMill
In this video I’ll be covering 5 predefined momentum screening ideas from our Trading Ideas' section in ChartMill. Momentum trading means that you are primarily concerned with short-term positions. The intention is to buy stocks which are already rising and to sell them again quickly as soon as the first signs are visible that the rising is losing momentum. As an investor you try to benefit from the high volatility associated with the rise in this relatively short time.
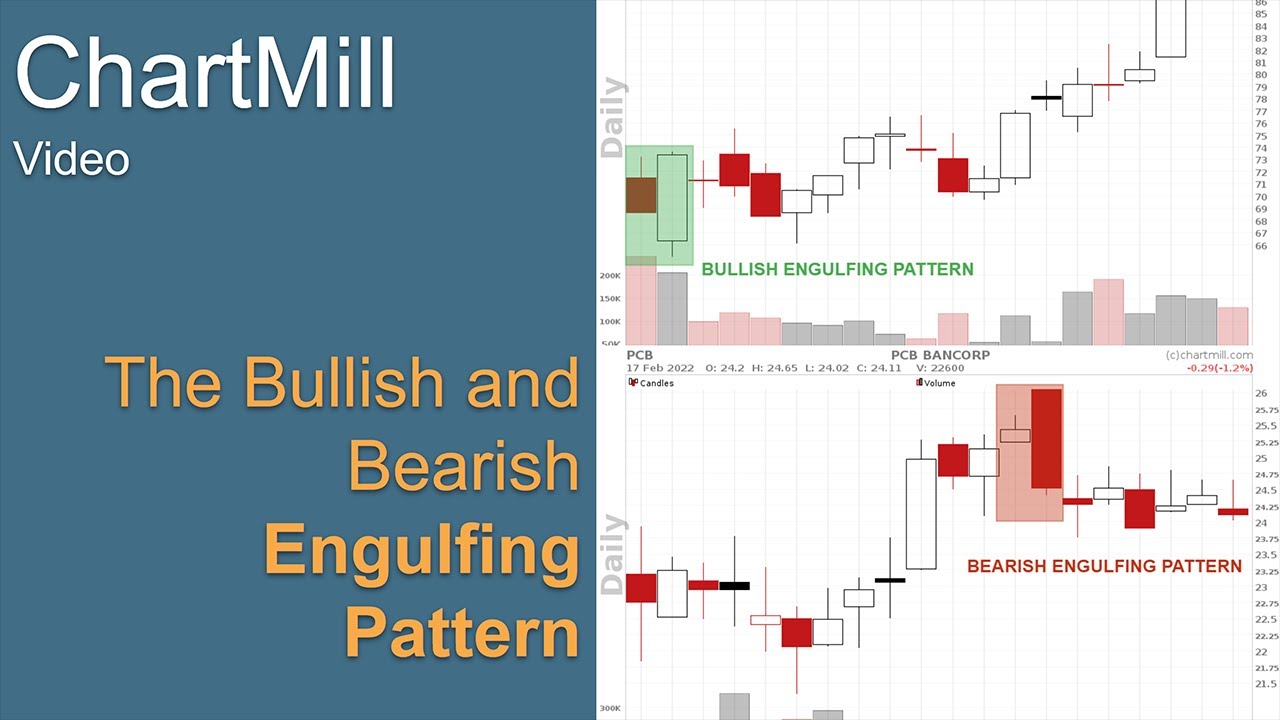
How to Trade Bullish and Bearish Engulfing Patterns?
A short video on how to use the bullish and bearish engulfing candlestick signals to find reversal patterns in any price chart.
Candlestick: Bullish Engulfing
The actual Bullish Engulfing signal
Signal: Strong Stocks
This filters for strong stocks. Strong stocks are high relative strength stocks that show a stable uptrend.
Price: Above 5
This filter excludes all stocks that are trading below 5 dollar.
Average Volume: 50 SMA > 200K
This filter excludes all stocks that have a lower daily average volume than 200K.
10SMA and 20SMA
Regional Run
Run this screen in your favorite region. You can always further fine tune the screen by changing the general settings after it opened in the screener.