Why PDD HOLDINGS INC (NASDAQ:PDD) qualifies as a high growth stock.
By Mill Chart
Last update: Mar 8, 2025
Our stockscreener has identified a possible breakout setup on PDD HOLDINGS INC (NASDAQ:PDD). This occurs when the stock consolidates following a significant upward movement. While the breakout outcome cannot be guaranteed, it may be worth monitoring NASDAQ:PDD for potential opportunities.
In-Depth Technical Analysis of NASDAQ:PDD
ChartMill assigns a Technical Rating to every stock. This score ranges from 0 to 10 and is updated daily. The score is determined by evaluating multiple technical indicators and properties.
Overall PDD gets a technical rating of 7 out of 10. In the past year, PDD was one of the better performing stocks in the market. The medium term picture became unclear, although we see some improvement happening in recent action.
- The long term trend is still neutral, but the short term trend is positive, so the stock is getting more and more appreciated by traders and investors.
- Looking at the yearly performance, PDD did better than 87% of all other stocks. However, this relatively good performance is mostly due to a recent big move.
- PDD is an average performer in the Broadline Retail industry, it outperforms 67% of 32 stocks in the same industry.
- PDD is currently trading in the middle of its 52 week range. This is in line with the S&P500 Index, which is also trading in the middle of its range.
- In the last month PDD has a been trading in the 110.04 - 133.33 range, which is quite wide. It is currently trading in the middle of this range, so some resistance may be found above.
Check the latest full technical report of PDD for a complete technical analysis.
How do we evaluate the setup for NASDAQ:PDD?
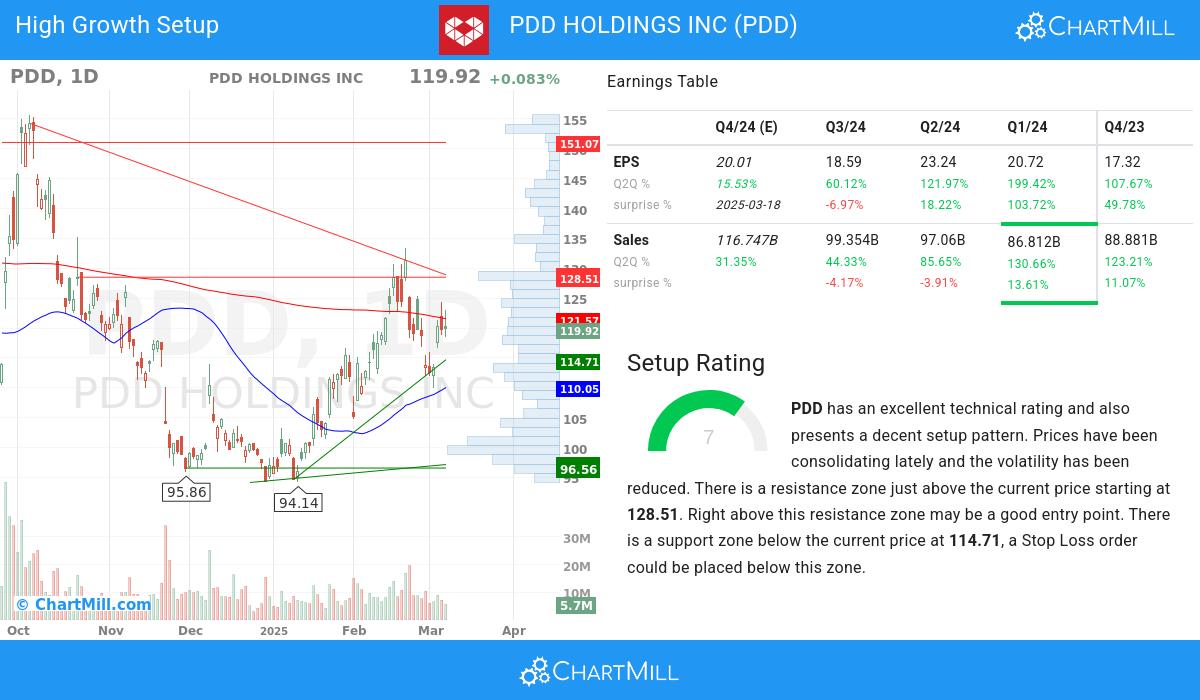
ChartMill incorporates a Setup Rating in its analysis, which measures the extent of consolidation in a stock over recent days and weeks. This rating, ranging from 0 to 10, is updated daily and takes into account multiple short-term technical indicators. The current setup rating for NASDAQ:PDD is 7:
Besides having an excellent technical rating, PDD also presents a decent setup pattern. Prices have been consolidating lately and the volatility has been reduced. There is a resistance zone just above the current price starting at 128.51. Right above this resistance zone may be a good entry point. There is a support zone below the current price at 114.71, a Stop Loss order could be placed below this zone.
What matters for high growth investors.
Earnings Momentum
- PDD has demonstrated consistent growth in its earnings per share (EPS) from one quarter to another (Q2Q), with a 60.12% increase. This indicates improving financial performance and the company's effective management of its operations.
- PDD has experienced 114.0% growth in EPS over a 12 month period, demonstrating its ability to generate sustained and positive earnings momentum.
- accelerating EPS growth for PDD: the current Q2Q growth of 60.12% exceeds the previous year Q2Q growth of 34.69%.
- With impressive quarter-to-quarter (Q2Q) revenue growth of 44.33%, PDD showcases its ability to generate increased sales and revenue. This growth indicates the company's strong customer demand and its effective business strategies.
- With notable 1-year revenue growth of 87.39%, PDD exemplifies its ability to generate increased sales and revenue streams. This growth signifies the company's strong business performance and its potential for future growth.
- PDD has a strong history of beating EPS estimates 3 times in the last 4 quarters, signaling its ability to consistently exceed market expectations. This indicates the company's strong financial performance and its potential for creating shareholder value.
Financial Strength & Profitability
- With a favorable trend in its operating margin over the past year, PDD demonstrates its ability to enhance profitability through efficient operations. This growth reflects the company's focus on optimizing its cost structure.
- PDD has experienced notable growth in its free cash flow (FCF) over the past year, signaling improved cash generation and strong financial performance. This growth suggests the company's ability to generate excess cash for reinvestment or shareholder returns.
- With a favorable Return on Equity (ROE) of 38.87%, PDD demonstrates its ability to deliver attractive returns for shareholders. This metric highlights the company's effective management of assets and its profitability.
- PDD has a Debt/Equity ratio of 0.02, indicating a balanced approach to financing growth.
Strong Market Performance
- The Relative Strength (RS) of PDD has consistently been strong, with a current 87.27 rating. This indicates the stock's ability to exhibit relative price outperformance and reflects its competitive strength. PDD HOLDINGS INC demonstrates promising potential for sustained price momentum.
More high growth momentum breakout stocks can be found in our High Growth Momentum Breakout screen.
Keep in mind
Important Note: The content of this article is not intended as trading advice. It is essential to perform your own analysis and exercise caution when making trading decisions. The article presents observations created by automated analysis but does not guarantee any trading or investment outcomes. Always trade responsibly and make independent judgments.
119.92
+0.1 (+0.08%)
Find more stocks in the Stock Screener
PDD Latest News and Analysis
 a day ago - ChartmillWhy PDD HOLDINGS INC (NASDAQ:PDD) qualifies as a high growth stock.
A fundamental and technical analysis of (NASDAQ:PDD): Why the high growth investor may take a look at PDD HOLDINGS INC (NASDAQ:PDD).
 13 days ago - ChartmillInvestors seeking growth at a reasonable cost should explore NASDAQ:PDD.
Uncover the potential of PDD HOLDINGS INC, a growth stock reasonably priced. NASDAQ:PDD is excelling in growth aspects, maintaining a healthy financial position, and still offers an attractive valuation.
 17 days ago - ChartmillInvestors should take notice of NASDAQ:PDD—it offers a great deal for the fundamentals it presents.
PDD HOLDINGS INC has a stellar value proposition. NASDAQ:PDD not only scores well in profitability, solvency, and liquidity but also maintains a very reasonable price point.
