Investors should take notice of NASDAQ:PDD—it offers a great deal for the fundamentals it presents.
By Mill Chart
Last update: Feb 20, 2025
Our stock screener has singled out PDD HOLDINGS INC (NASDAQ:PDD) as a stellar value proposition. NASDAQ:PDD not only scores well in profitability, solvency, and liquidity but also maintains a very reasonable price point. We'll explore this further.
Analyzing Valuation Metrics
ChartMill assigns a Valuation Rating to every stock. This score ranges from 0 to 10 and evaluates the different valuation aspects and compares the price to earnings and cash flows, while taking into account profitability and growth. NASDAQ:PDD scores a 9 out of 10:
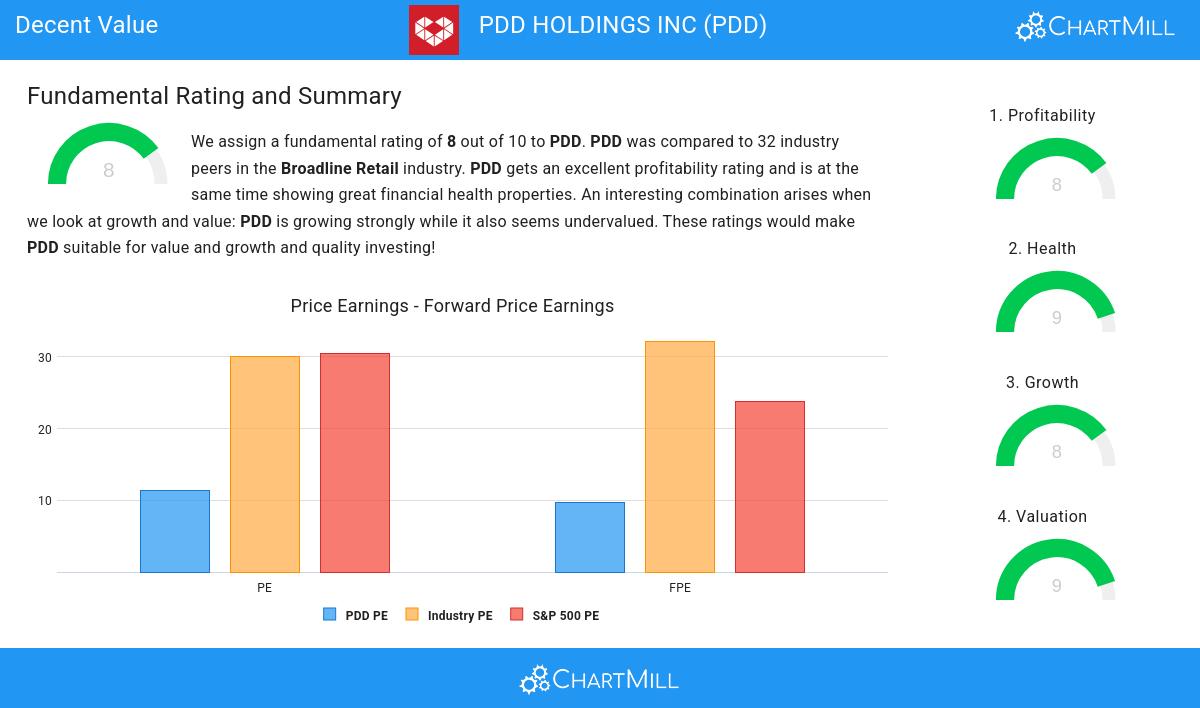
- The Price/Earnings ratio is 11.35, which indicates a very decent valuation of PDD.
- PDD's Price/Earnings ratio is a bit cheaper when compared to the industry. PDD is cheaper than 77.42% of the companies in the same industry.
- PDD's Price/Earnings ratio indicates a rather cheap valuation when compared to the S&P500 average which is at 30.42.
- Based on the Price/Forward Earnings ratio of 9.73, the valuation of PDD can be described as reasonable.
- Compared to the rest of the industry, the Price/Forward Earnings ratio of PDD indicates a rather cheap valuation: PDD is cheaper than 80.65% of the companies listed in the same industry.
- Compared to an average S&P500 Price/Forward Earnings ratio of 23.75, PDD is valued rather cheaply.
- PDD's Enterprise Value to EBITDA ratio is a bit cheaper when compared to the industry. PDD is cheaper than 77.42% of the companies in the same industry.
- Compared to the rest of the industry, the Price/Free Cash Flow ratio of PDD indicates a rather cheap valuation: PDD is cheaper than 80.65% of the companies listed in the same industry.
- PDD's low PEG Ratio(NY), which compensates the Price/Earnings for growth, indicates a rather cheap valuation of the company.
- The excellent profitability rating of PDD may justify a higher PE ratio.
- PDD's earnings are expected to grow with 34.87% in the coming years. This may justify a more expensive valuation.
Assessing Profitability for NASDAQ:PDD
ChartMill assigns a proprietary Profitability Rating to each stock. The score is computed by evaluating various profitability ratios and margins and ranges from 0 to 10. NASDAQ:PDD was assigned a score of 8 for profitability:
- Looking at the Return On Assets, with a value of 23.19%, PDD belongs to the top of the industry, outperforming 100.00% of the companies in the same industry.
- PDD has a Return On Equity of 38.87%. This is amongst the best in the industry. PDD outperforms 96.77% of its industry peers.
- Looking at the Return On Invested Capital, with a value of 31.27%, PDD belongs to the top of the industry, outperforming 100.00% of the companies in the same industry.
- PDD had an Average Return On Invested Capital over the past 3 years of 17.97%. This is significantly above the industry average of 11.29%.
- The 3 year average ROIC (17.97%) for PDD is below the current ROIC(31.27%), indicating increased profibility in the last year.
- With an excellent Profit Margin value of 29.10%, PDD belongs to the best of the industry, outperforming 100.00% of the companies in the same industry.
- PDD has a Operating Margin of 28.28%. This is amongst the best in the industry. PDD outperforms 100.00% of its industry peers.
- Looking at the Gross Margin, with a value of 62.06%, PDD belongs to the top of the industry, outperforming 83.87% of the companies in the same industry.
Exploring NASDAQ:PDD's Health
Every stock is evaluated by ChartMill, receiving a Health Rating on a scale of 0 to 10. This assessment considers different health aspects, including liquidity and solvency, both in absolute terms and relative to industry peers. NASDAQ:PDD has achieved a 9 out of 10:
- PDD has an Altman-Z score of 6.57. This indicates that PDD is financially healthy and has little risk of bankruptcy at the moment.
- With an excellent Altman-Z score value of 6.57, PDD belongs to the best of the industry, outperforming 83.87% of the companies in the same industry.
- PDD has a debt to FCF ratio of 0.04. This is a very positive value and a sign of high solvency as it would only need 0.04 years to pay back of all of its debts.
- With an excellent Debt to FCF ratio value of 0.04, PDD belongs to the best of the industry, outperforming 93.55% of the companies in the same industry.
- PDD has a Debt/Equity ratio of 0.02. This is a healthy value indicating a solid balance between debt and equity.
- The Debt to Equity ratio of PDD (0.02) is better than 77.42% of its industry peers.
- A Current Ratio of 2.15 indicates that PDD has no problem at all paying its short term obligations.
- With a decent Current ratio value of 2.15, PDD is doing good in the industry, outperforming 70.97% of the companies in the same industry.
- PDD has a Quick Ratio of 2.15. This indicates that PDD is financially healthy and has no problem in meeting its short term obligations.
- Looking at the Quick ratio, with a value of 2.15, PDD belongs to the top of the industry, outperforming 83.87% of the companies in the same industry.
ChartMill's Evaluation of Growth
Every stock receives a Growth Rating from ChartMill, ranging from 0 to 10. This rating assesses various growth aspects, including historical and projected EPS and revenue growth. NASDAQ:PDD boasts a 8 out of 10:
- PDD shows a strong growth in Earnings Per Share. In the last year, the EPS has been growing by 113.90%, which is quite impressive.
- PDD shows a strong growth in Revenue. In the last year, the Revenue has grown by 87.39%.
- The Revenue has been growing by 79.96% on average over the past years. This is a very strong growth!
- Based on estimates for the next years, PDD will show a very strong growth in Earnings Per Share. The EPS will grow by 23.38% on average per year.
- PDD is expected to show a strong growth in Revenue. In the coming years, the Revenue will grow by 26.33% yearly.
Our Decent Value screener lists more Decent Value stocks and is updated daily.
Check the latest full fundamental report of PDD for a complete fundamental analysis.
Keep in mind
This is not investing advice! The article highlights some of the observations at the time of writing, but you should always make your own analysis and invest based on your own insights.
124.43
-4.03 (-3.14%)
Find more stocks in the Stock Screener
PDD Latest News and Analysis
 2 hours ago - ChartmillInvestors should take notice of NASDAQ:PDD—it offers a great deal for the fundamentals it presents.
PDD HOLDINGS INC has a stellar value proposition. NASDAQ:PDD not only scores well in profitability, solvency, and liquidity but also maintains a very reasonable price point.
 13 days ago - ChartmillIs NASDAQ:PDD on the Verge of a Major Breakout as a Strong Growth Stock?
Based on a technical and fundamental analysis of NASDAQ:PDD we ask: Why PDD HOLDINGS INC (NASDAQ:PDD) Is a Promising High-Growth Stock in the Midst of Consolidation.
 17 days ago - ChartmillNASDAQ:PDD stands out as a growth opportunity that won't break the bank.
NASDAQ:PDD is scoring great on several growth aspects while it also shows decent health and profitability. At the same time it remains remains attractively priced.
