NASDAQ:PDD stands out as a growth opportunity that won't break the bank.
By Mill Chart
Last update: Feb 3, 2025
Take a closer look at PDD HOLDINGS INC (NASDAQ:PDD), an affordable growth stock uncovered by our stock screener. NASDAQ:PDD boasts strong growth prospects and excels in financial health indicators, all while maintaining a reasonable valuation. Let's break it down further.
Growth Insights: NASDAQ:PDD
ChartMill employs its own Growth Rating system for all stocks. This score, ranging from 0 to 10, is derived by evaluating different growth factors, such as EPS and revenue growth, taking into account both past performance and future projections. NASDAQ:PDD has earned a 8 for growth:
- PDD shows a strong growth in Earnings Per Share. In the last year, the EPS has been growing by 113.90%, which is quite impressive.
- Looking at the last year, PDD shows a very strong growth in Revenue. The Revenue has grown by 87.39%.
- Measured over the past years, PDD shows a very strong growth in Revenue. The Revenue has been growing by 79.96% on average per year.
- PDD is expected to show a strong growth in Earnings Per Share. In the coming years, the EPS will grow by 23.38% yearly.
- The Revenue is expected to grow by 26.33% on average over the next years. This is a very strong growth
Valuation Assessment of NASDAQ:PDD
ChartMill provides a Valuation Rating to every stock, ranging from 0 to 10. This rating assesses various valuation aspects, comparing price to earnings and cash flows, while considering factors like profitability and growth. NASDAQ:PDD boasts a 9 out of 10:
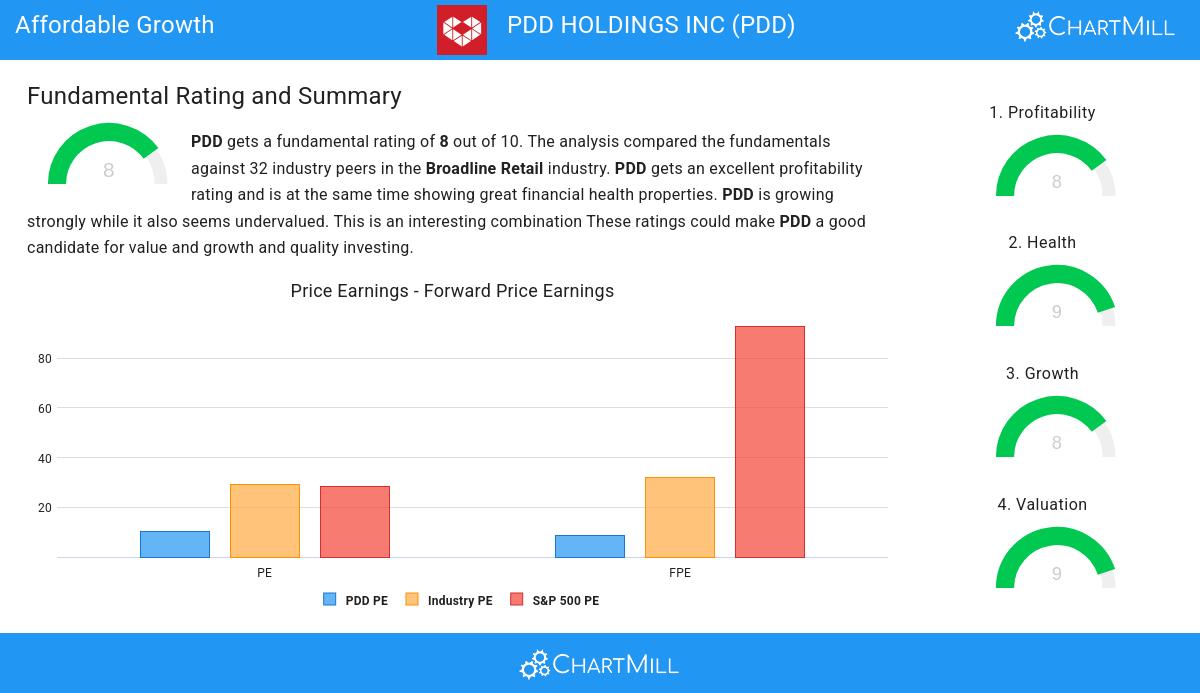
- Based on the Price/Earnings ratio of 10.16, the valuation of PDD can be described as reasonable.
- Compared to the rest of the industry, the Price/Earnings ratio of PDD indicates a somewhat cheap valuation: PDD is cheaper than 77.42% of the companies listed in the same industry.
- The average S&P500 Price/Earnings ratio is at 28.46. PDD is valued rather cheaply when compared to this.
- Based on the Price/Forward Earnings ratio of 8.63, the valuation of PDD can be described as reasonable.
- Based on the Price/Forward Earnings ratio, PDD is valued cheaper than 87.10% of the companies in the same industry.
- The average S&P500 Price/Forward Earnings ratio is at 92.87. PDD is valued rather cheaply when compared to this.
- Based on the Enterprise Value to EBITDA ratio, PDD is valued cheaper than 80.65% of the companies in the same industry.
- Compared to the rest of the industry, the Price/Free Cash Flow ratio of PDD indicates a rather cheap valuation: PDD is cheaper than 83.87% of the companies listed in the same industry.
- PDD's low PEG Ratio(NY), which compensates the Price/Earnings for growth, indicates a rather cheap valuation of the company.
- The excellent profitability rating of PDD may justify a higher PE ratio.
- PDD's earnings are expected to grow with 35.55% in the coming years. This may justify a more expensive valuation.
ChartMill's Evaluation of Health
To gauge a stock's financial health, ChartMill utilizes a Health Rating on a scale of 0 to 10. This comprehensive evaluation encompasses liquidity and solvency, both in absolute terms and in comparison to industry peers. NASDAQ:PDD has earned a 9 out of 10:
- An Altman-Z score of 6.14 indicates that PDD is not in any danger for bankruptcy at the moment.
- PDD has a Altman-Z score of 6.14. This is amongst the best in the industry. PDD outperforms 80.65% of its industry peers.
- The Debt to FCF ratio of PDD is 0.04, which is an excellent value as it means it would take PDD, only 0.04 years of fcf income to pay off all of its debts.
- PDD has a Debt to FCF ratio of 0.04. This is amongst the best in the industry. PDD outperforms 93.55% of its industry peers.
- PDD has a Debt/Equity ratio of 0.02. This is a healthy value indicating a solid balance between debt and equity.
- PDD has a better Debt to Equity ratio (0.02) than 77.42% of its industry peers.
- PDD has a Current Ratio of 2.15. This indicates that PDD is financially healthy and has no problem in meeting its short term obligations.
- With a decent Current ratio value of 2.15, PDD is doing good in the industry, outperforming 70.97% of the companies in the same industry.
- PDD has a Quick Ratio of 2.15. This indicates that PDD is financially healthy and has no problem in meeting its short term obligations.
- The Quick ratio of PDD (2.15) is better than 83.87% of its industry peers.
Assessing Profitability for NASDAQ:PDD
Discover ChartMill's exclusive Profitability Rating, a proprietary metric that assesses stocks on a scale of 0 to 10. It takes into consideration various profitability ratios and margins, both in absolute terms and relative to industry peers. Notably, NASDAQ:PDD has achieved a 8:
- PDD's Return On Assets of 23.19% is amongst the best of the industry. PDD outperforms 100.00% of its industry peers.
- With an excellent Return On Equity value of 38.87%, PDD belongs to the best of the industry, outperforming 96.77% of the companies in the same industry.
- With an excellent Return On Invested Capital value of 31.27%, PDD belongs to the best of the industry, outperforming 100.00% of the companies in the same industry.
- PDD had an Average Return On Invested Capital over the past 3 years of 17.97%. This is significantly above the industry average of 11.22%.
- The 3 year average ROIC (17.97%) for PDD is below the current ROIC(31.27%), indicating increased profibility in the last year.
- PDD has a better Profit Margin (29.10%) than 100.00% of its industry peers.
- PDD's Operating Margin of 28.28% is amongst the best of the industry. PDD outperforms 100.00% of its industry peers.
- PDD has a better Gross Margin (62.06%) than 83.87% of its industry peers.
More Affordable Growth stocks can be found in our Affordable Growth screener.
For an up to date full fundamental analysis you can check the fundamental report of PDD
Keep in mind
This is not investing advice! The article highlights some of the observations at the time of writing, but you should always make your own analysis and invest based on your own insights.
93.69
+1.34 (+1.45%)
Find more stocks in the Stock Screener
PDD Latest News and Analysis
 10 days ago - ChartmillFor those who appreciate growth without the sticker shock, PDD HOLDINGS INC (NASDAQ:PDD) is worth considering.
NASDAQ:PDD is scoring great on several growth aspects while it also shows decent health and profitability. At the same time it remains remains attractively priced.
 16 days ago - ChartmillPDD HOLDINGS INC (NASDAQ:PDD)—Positioned as a High-Growth Stock, Ready for a Potential Breakout.
Based on fundamental and technical analysis of NASDAQ:PDD we ask: Why PDD HOLDINGS INC (NASDAQ:PDD) Is a Standout High-Growth Stock in a Consolidation Phase.
