
PDD HOLDINGS INC (NASDAQ:PDD)—Positioned as a High-Growth Stock, Ready for a Potential Breakout.
By Mill Chart
Last update: Apr 2, 2025
In this article, we'll take a closer look at PDD HOLDINGS INC (NASDAQ:PDD) as a potential candidate for growth investing. While it's important for investors to conduct their own research, PDD HOLDINGS INC has piqued our interest by appearing on our strong growth and breakout radar. Let's explore further.
Deciphering PDD's Growth Rating
ChartMill assigns a Growth Rating to every stock. This score ranges from 0 to 10 and evaluates the different growth aspects like EPS and Revenue, both in the past as in the future. PDD scores a 8 out of 10:
- The Earnings Per Share has grown by an impressive 78.54% over the past year.
- The Earnings Per Share has been growing by 106.51% on average over the past years. This is a very strong growth
- The Revenue has grown by 59.04% in the past year. This is a very strong growth!
- Measured over the past years, PDD shows a very strong growth in Revenue. The Revenue has been growing by 67.20% on average per year.
- PDD is expected to show quite a strong growth in Earnings Per Share. In the coming years, the EPS will grow by 10.29% yearly.
- The Revenue is expected to grow by 14.39% on average over the next years. This is quite good.
Health Assessment of PDD
ChartMill employs a unique Health Rating system for all stocks. This rating, ranging from 0 to 10, is determined by analyzing various liquidity and solvency ratios. For PDD, the assigned 9 for health provides valuable insights:
- PDD has an Altman-Z score of 6.41. This indicates that PDD is financially healthy and has little risk of bankruptcy at the moment.
- PDD has a better Altman-Z score (6.41) than 87.10% of its industry peers.
- There is no outstanding debt for PDD. This means it has a Debt/Equity and Debt/FCF ratio of 0 and it is amongst the best of the sector and industry.
- PDD has a Current Ratio of 2.21. This indicates that PDD is financially healthy and has no problem in meeting its short term obligations.
- The Current ratio of PDD (2.21) is better than 77.42% of its industry peers.
- A Quick Ratio of 2.21 indicates that PDD has no problem at all paying its short term obligations.
- Looking at the Quick ratio, with a value of 2.21, PDD belongs to the top of the industry, outperforming 93.55% of the companies in the same industry.
How do we evaluate the Profitability for PDD?
ChartMill assigns a proprietary Profitability Rating to each stock. The score is computed by evaluating various profitability ratios and margins and ranges from 0 to 10. PDD was assigned a score of 8 for profitability:
- PDD has a better Return On Assets (22.26%) than 100.00% of its industry peers.
- PDD has a Return On Equity of 35.89%. This is amongst the best in the industry. PDD outperforms 93.55% of its industry peers.
- PDD's Return On Invested Capital of 28.81% is amongst the best of the industry. PDD outperforms 100.00% of its industry peers.
- The Average Return On Invested Capital over the past 3 years for PDD is significantly above the industry average of 11.40%.
- The last Return On Invested Capital (28.81%) for PDD is above the 3 year average (25.13%), which is a sign of increasing profitability.
- PDD has a Profit Margin of 28.55%. This is amongst the best in the industry. PDD outperforms 100.00% of its industry peers.
- PDD's Profit Margin has improved in the last couple of years.
- The Operating Margin of PDD (27.53%) is better than 100.00% of its industry peers.
- In the last couple of years the Operating Margin of PDD has grown nicely.
- The Gross Margin of PDD (60.92%) is better than 83.87% of its industry peers.
Looking at the Setup
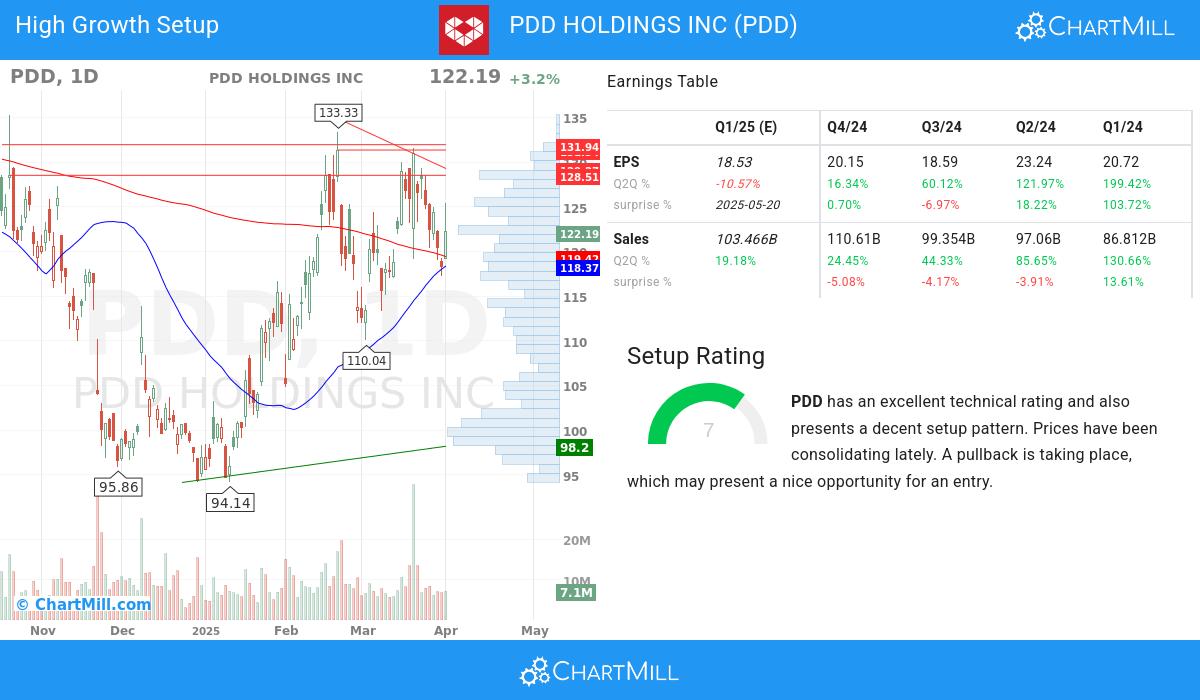
The Setup Rating of a stock determines to which extend the stock is consolidating. This score also ranges from 0 to 10 and is updated daily. The setup score evaluates various short term technical indicators. For PDD this score is currently 7:
Besides having an excellent technical rating, PDD also presents a decent setup pattern. Prices have been consolidating lately. A pullback is taking place, which may present a nice opportunity for an entry.
Our Strong Growth screener lists more Strong Growth stocks and is updated daily.
Our latest full fundamental report of PDD contains the most current fundamental analsysis.
Our latest full technical report of PDD contains the most current technical analsysis.
Keep in mind
This article should in no way be interpreted as advice. The article is based on the observed metrics at the time of writing, but you should always make your own analysis and trade or invest at your own responsibility.
103.27
+2.84 (+2.83%)
Find more stocks in the Stock Screener
PDD Latest News and Analysis
 17 days ago - ChartmillFor those who appreciate growth without the sticker shock, PDD HOLDINGS INC (NASDAQ:PDD) is worth considering.
NASDAQ:PDD is scoring great on several growth aspects while it also shows decent health and profitability. At the same time it remains remains attractively priced.
