Market Monitor March 6 (Burlington Stores, BJ's Wholesale Club UP, Marvell, MongoDB DOWN)
By Kristoff De Turck - reviewed by Aldwin Keppens
Last update: Mar 7, 2025

Tough Day for US Markets: Falling Stocks, Weak Dollar, and Concerns Over Trump’s Trade Policies
US stock markets closed sharply lower on Thursday, while the dollar lost ground. Investor uncertainty was fueled by President Trump’s unpredictable trade policies, with new tariffs being announced and then postponed for Mexico and Canada. The Dow Jones dropped 1%, the S&P 500 fell 1.78%, and the Nasdaq plunged 2.61%, officially entering correction territory.
Tech stocks took the hardest hit. Marvell Technology (MRVL | -19.8%) plummeted nearly 20% after issuing a disappointing revenue forecast, while AI giant Nvidia (NVDA | -5.74%) fell almost 6%. Other major tech players like Microsoft (MSFT | -1.03%), Amazon (AMZN | -3.68%), and Meta (META | -4.35%) also suffered significant losses.
Investors sought safe havens, causing the Japanese yen and Swiss franc to rise, while the US dollar weakened. The Cboe Volatility Index surged to its highest level in months, reflecting rising market nervousness.
Economic signals were mixed: new jobless claims dropped more than expected, but planned layoffs skyrocketed by 245%, the highest level since July 2020, raising concerns about economic stability in the US.
International worries about Trump’s policies also grew. European leaders voiced concerns and pledged more support for Ukraine after the US suspended military aid to Kyiv, raising doubts about America’s reliability as an ally.
Oil prices remained mostly stable, while gold saw a slight decline.
Company news
- Burlington Stores (BURL | +8.74%) was one of the few bright spots, jumping 9% after strong quarterly earnings.
- BJ's Wholesale Club (BJ | +12.23%) posts better than expected earnings.
- In contrast, MongoDB (MDB | -26.94%) shares crashed 27% following disappointing guidance.
Markets remain volatile, with investors closely watching for upcoming economic data and further developments in US trade policies.
Daily Market Analysis – March 06, 2025 (After Market Close)
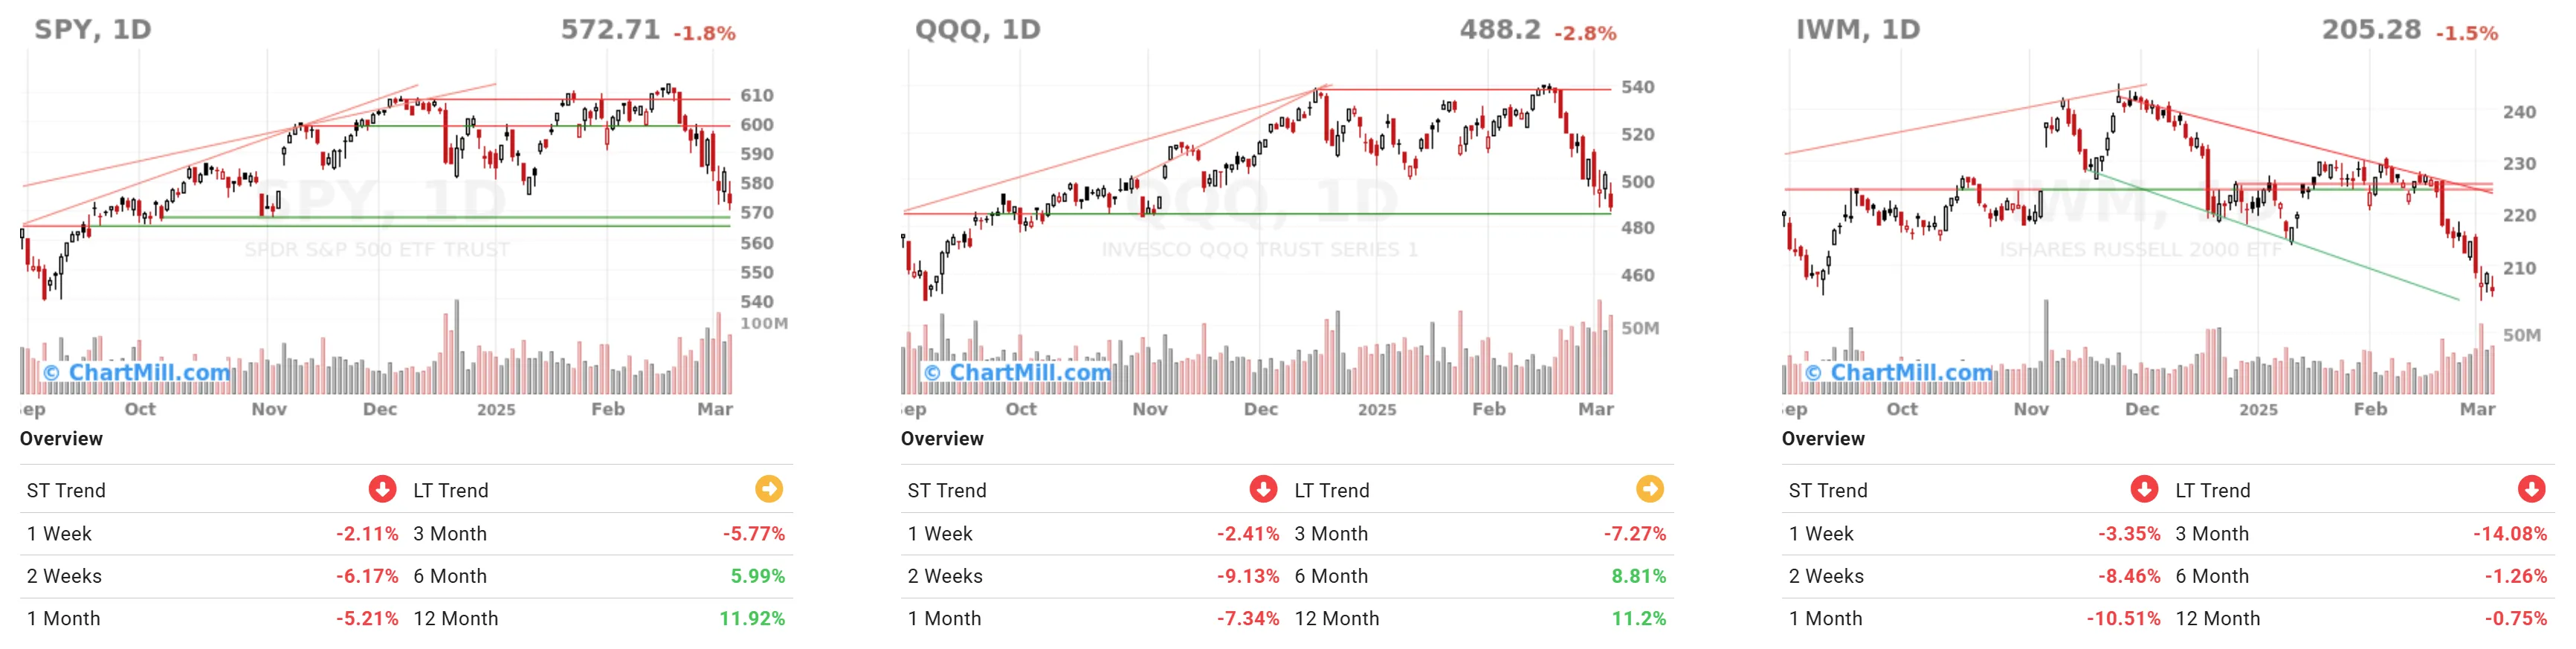
SPY (S&P 500 ETF - 572.71, -1.8%)
- Short-term (ST) Trend: Down
- Long-term (LT) Trend: Neutral
Key Observations:
SPY has been declining in the short term, losing 2.11% in one week and 6.17% in two weeks, indicating strong selling pressure. The ETF is currently testing a key support level, as seen from the horizontal lines on the chart.
A decisive break below this level could signal a further downturn. The 6-month and 12-month performance remain positive (+5.99% and +11.92%, respectively).
QQQ (Nasdaq-100 ETF - 488.2, -2.8%)
- Short-term (ST) Trend: Down
- Long-term (LT) Trend: Neutral
Key Observations:
QQQ saw an even sharper decline than SPY, dropping 2.80% in a single session and 9.13% over two weeks. The ETF has fallen below a critical support zone from previous highs, signaling potential weakness in tech-heavy stocks.
While the 6-month and 12-month gains are still positive (+8.81% and +11.2%), this pullback could indicate the start of a deeper correction.
IWM (Russell 2000 ETF - 205.28, -1.5%)
- Short-term (ST) Trend: Down
- Long-term (LT) Trend: Down
Key Observations:
IWM is the weakest among the three ETFs, showing a long-term downtrend and the worst 12-month performance (-0.75%). Short-term losses have been significant, with a 10.51% drop in one month and a 3.35% decline in the last week.
The chart suggests that IWM is breaking down below a critical support level, which could lead to further declines. Small-cap stocks appear to be struggling the most in the current market environment.
Sector Performance Analysis

1-Week Performance:
All sectors show notable declines, with the only exception being Materials, which is slightly positive.
1-Month Performance:
All sectors show negative performance. Among the worst: Information Technology, Energy and Healthcare
3-Month Performance:
All red...
Market Breadth Analysis
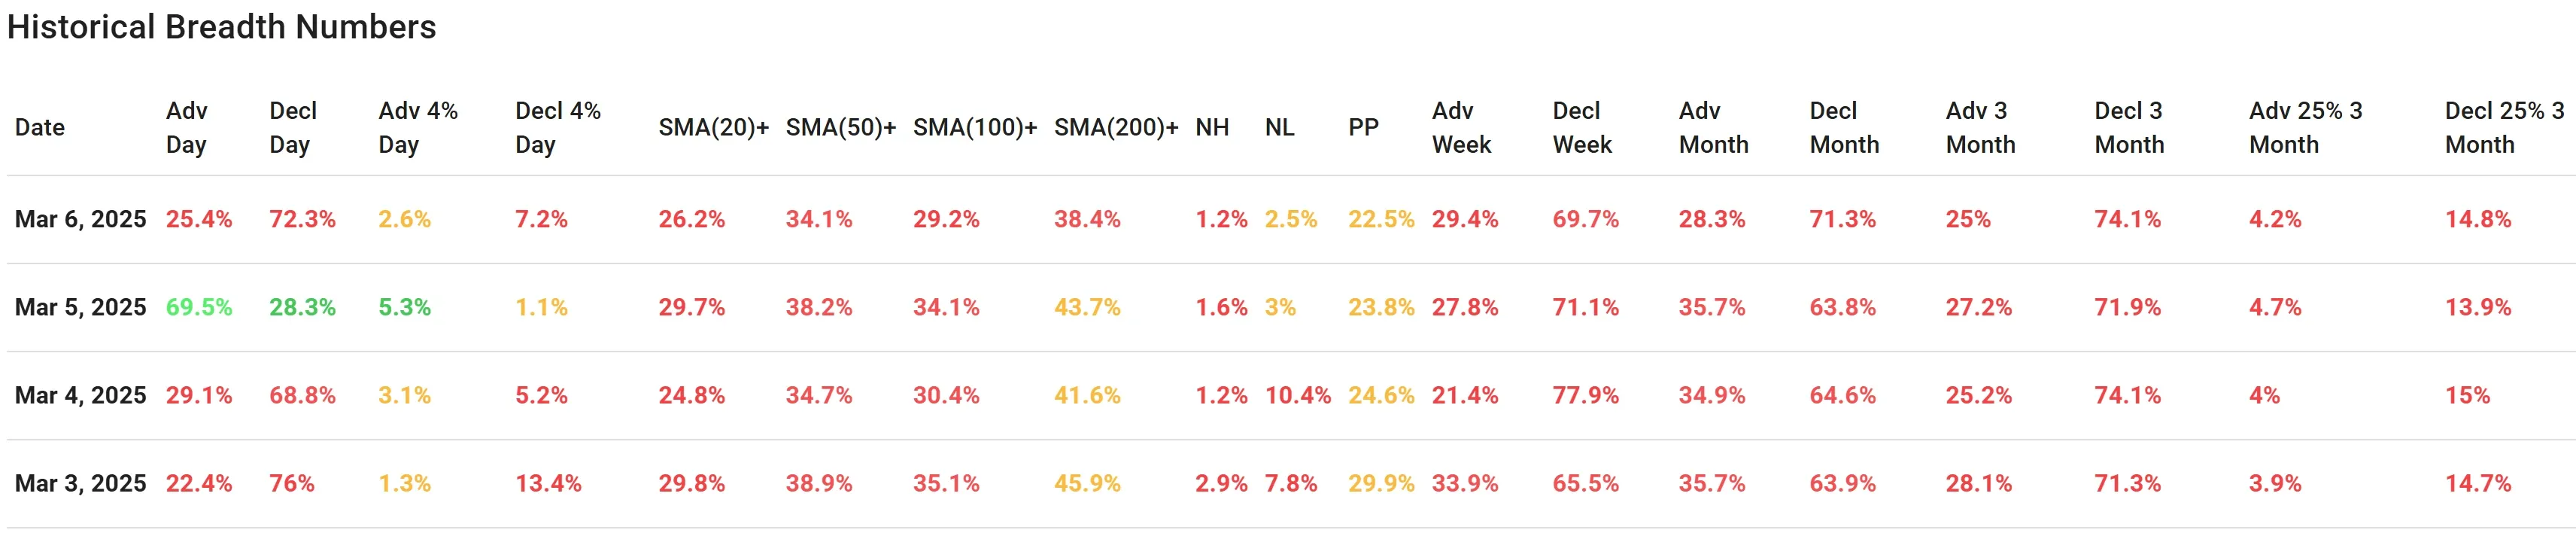
- Advancing stocks: 25.4% (significantly lower than earlier in the week).
- Declining stocks: 72.3% (showing widespread market weakness).
- 4% up days: 2.6%, indicating very few stocks showed strong upside momentum.
SMA (Simple Moving Averages) Breakdown:
- SMA(20): 26.2% (below this short-term level, showing weakness).
- SMA(50): 34.1% (only one-third of stocks above this mid-term average).
- SMA(200): 38.4% (long-term trend weakening).
Comparison with Earlier This Week:
- On March 5, advancing stocks were at 69.5%, significantly higher than March 6 (25.4%).
- Earlier in the week, SMA(50) and SMA(200) were stronger, suggesting that the past few sessions have accelerated market deterioration.
- The percentage of stocks above their 50-day and 200-day moving averages has declined, indicating a broad weakening of momentum.
Key Observations:
- The market saw a sharp negative shift on March 6, with a strong downside move.
- Earlier in the week, there were signs of resilience, but that changed drastically on Thursday.
- The breadth indicators suggest increasing weakness, with fewer stocks holding above key moving averages.
- The trend suggests that market sentiment is turning bearish, and unless there’s a reversal soon, more downside could follow.
General Conclusion
- US equities are facing increasing selling pressure, with SPY, QQQ, and IWM all in downtrends.
- Small caps (IWM) are the weakest segment, reinforcing broader market concerns.
- Market breadth has deteriorated sharply in the past few sessions, indicating a shift in momentum toward the downside.
- If key support levels in SPY and QQQ break, further declines could follow.
The market is at a critical juncture, and the next few sessions will be crucial in determining whether this is a deeper correction or just a temporary pullback.
199.25
-1.45 (-0.72%)
393.31
-3.58 (-0.9%)
70.84
-1.44 (-1.99%)
112.69
+2.12 (+1.92%)
625.66
-2.27 (-0.36%)
240.22
-17.43 (-6.76%)
187.65
-5.33 (-2.76%)
115.5
+3.17 (+2.82%)
Find more stocks in the Stock Screener
AMZN Latest News and Analysis
 2 days ago - ChartmillThese S&P500 stocks are the most active in today's session
Stay informed about the most active S&P500 stocks in today's session as we take a closer look at what's happening on the US markets on Friday. Discover the stocks that are generating the highest trading volume and driving market activity.
 2 days ago - ChartmillMarket Monitor March 6 (Burlington Stores, BJ's Wholesale Club UP, Marvell, MongoDB DOWN)
Tough Day for US Markets: Falling Stocks, Weak Dollar, and Concerns Over Trump’s Trade Policies
3 days ago - ChartmillStay informed about the most active stocks in the S&P500 index on Thursday's session.Let's have a look at what is happening on the US markets on Thursday. Below you can find the most active S&P500 stocks in today's session.
5 days ago - ChartmillLooking for the most active stocks in the S&P500 index on Tuesday?Curious about the most active S&P500 stocks in today's session? Get insights into the stocks that are leading the way in terms of trading volume and market attention.
11 days ago - ChartmillMost active S&P500 stocks in Wednesday's sessionCurious about the most active S&P500 stocks in today's session? Join us as we explore the US markets on Wednesday and uncover the stocks that are leading the way in terms of trading volume and market attention.
12 days ago - ChartmillCurious about the most active S&P500 stocks in today's session?Let's have a look at what is happening on the US markets on Tuesday. Below you can find the most active S&P500 stocks in today's session.
 13 days ago - ChartmillMarket Monitor February 24th13 days ago - ChartmillMarket Monitor February 23th
Wall Street Slumps Amid Consumer Worries and New Virus Concerns from China
16 days ago - ChartmillThese S&P500 stocks are the most active in today's sessionLet's have a look at what is happening on the US markets on Friday. Below you can find the most active S&P500 stocks in today's session.
19 days ago - ChartmillWhich S&P500 stocks are the most active on Tuesday?Let's have a look at what is happening on the US markets on Tuesday. Below you can find the most active S&P500 stocks in today's session.
