Fastest Growing Stocks
AMD is part of our fastest growing stocks screen, indicating it has high EPS and sales growth.
NASDAQ:AMD • US0079031078
The current stock price of AMD is 323.21 USD. Today AMD is down by -3.41%. In the past month the price increased by 64.87%. In the past year, price increased by 227.14%.
AMD currently appears in the following ChartMill screener lists.
AMD is part of our fastest growing stocks screen, indicating it has high EPS and sales growth.
AMD is part of our Strong Momentum Stocks screen, indicating it has an already in confirmed uptrend.
AMD appears in our Overbought Stocks screen, meaning it has experienced strong recent gains and may be trading at extended levels that could lead to short-term consolidation or pullback.
AMD is RSI overbought, meaning strong buying pressure may lead to a short-term consolidation or pullback.
AMD is part of our CAN SLIM stock list, indicating it is suited for high growth momentum investing and is a technical leader.
AMD occurs in our High EPS Growth Stocks screen list, indicating it is profitable, healthy and showing strong recent EPS growth.
AMD is part of our Minervini Stocks list, indicating it shows strong fundamental growth characteristics and technical strength.
ChartMill assigns a technical rating of 10 / 10 to AMD. When comparing the yearly performance of all stocks, AMD is one of the better performing stocks in the market, outperforming 97.5% of all stocks.
ChartMill assigns a fundamental rating of 6 / 10 to AMD. AMD has an average financial health and profitability rating.
On February 3, 2026 AMD reported an EPS of 1.53 and a revenue of 10.27B. The company beat EPS expectations (14.83% surprise) and beat revenue expectations (5.18% surprise).
59 analysts have analysed AMD and the average price target is 285.48 USD. This implies a price decrease of -11.67% is expected in the next year compared to the current price of 323.21.
For the next year, analysts expect an EPS growth of 61.77% and a revenue growth 36.91% for AMD
AMD is currently included in the following stock indexes tracked on ChartMill.
Over the last trailing twelve months AMD reported a non-GAAP Earnings per Share(EPS) of 4.17. The EPS increased by 25.6% compared to the year before.
| Industry Rank | Sector Rank | ||
|---|---|---|---|
| PM (TTM) | 12.51% | ||
| ROA | 5.64% | ||
| ROE | 6.88% | ||
| Debt/Equity | 0.04 |
AMD operates in the Semiconductors sub-industry within the Information Technology sector. This group contains 55 stocks and is scored by ChartMill on both price strength and growth momentum.
Each rank shows how many other sub-industries were outperformed over that timeframe.
| Symbol | Company Name | Technical Rating | Fundamental Rating | FPE | Market Cap |
|---|---|---|---|---|---|
| NVDA | NVIDIA CORP | 25.3 | 5.18T | ||
| AVGO | BROADCOM INC | 22.24 | 1.893T | ||
| MU | MICRON TECHNOLOGY INC | 5.05 | 568.703B | ||
| INTC | INTEL CORP | 81.89 | 424.376B | ||
| TXN | TEXAS INSTRUMENTS INC | 33.58 | 241.272B | ||
| ADI | ANALOG DEVICES INC | 29.14 | 187.108B | ||
| QCOM | QUALCOMM INC | 13.28 | 160.05B | ||
| MRVL | MARVELL TECHNOLOGY INC | 39.24 | 133.994B | ||
| MPWR | MONOLITHIC POWER SYSTEMS INC | 68.42 | 73.88B | ||
| MCHP | MICROCHIP TECHNOLOGY INC | 30.86 | 45.597B | ||
| MCHPP | MICROCHIP TECHNOLOGY INC - MCHP 7 1/2 03/15/28 | 26.55 | 39.222B | ||
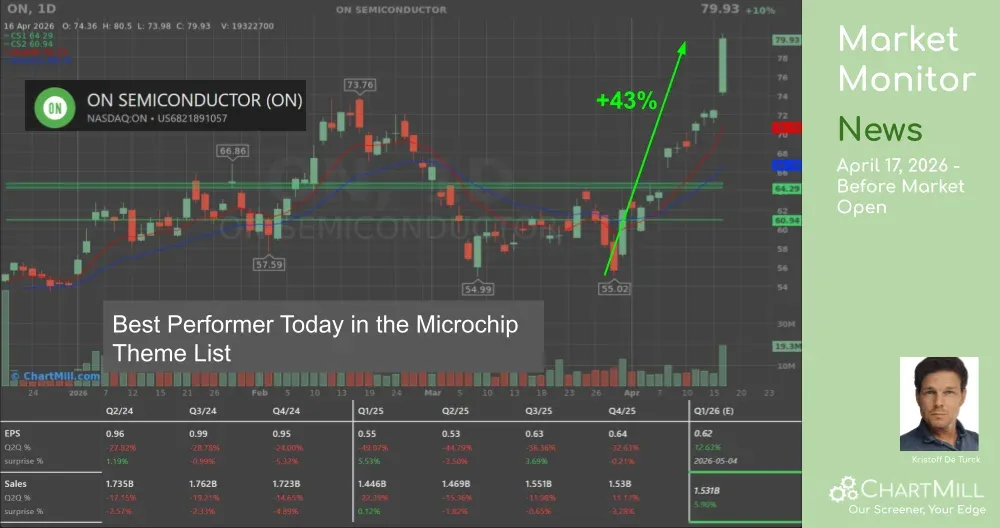
| ON | ON SEMICONDUCTOR | 31.69 | 36.698B |
View all stocks in the Semiconductors Industry | View all stocks in the Information Technology Sector | View all stocks on the Nasdaq Exchange | Find stocks with similar TA and Setup ratings on the USA exchanges | Find stocks with similar Fundamental rating on the USA exchanges | Find more growth stocks the USA exchanges | Find the competitors with the best technical ratings on the USA exchanges | Find the competitors with the best fundamentals on the USA exchanges | Find the competitors with the best valuation on the USA exchanges | Find the competitors with the best dividend on the USA exchanges | Find the competitors with the best analyst ratings on the USA exchanges
![]() Advanced Micro Devices, Inc. engages in the provision of semiconductor businesses. The company is headquartered in Santa Clara, California and currently employs 31,000 full-time employees. The firm is focused on high-performance computing, graphics and visualization technologies. Its segments include Data Center, Client and Gaming, and Embedded. Data Center segment includes artificial intelligence (AI) accelerators, microprocessors (CPUs) for servers, graphics processing units (GPUs), accelerated processing units (APUs), data processing units (DPUs), Field Programmable Gate Arrays (FPGAs), smart network interface Cards (SmartNICs) and Adaptive system-on-Chip (SoC) products for data centers. Client and Gaming segment includes CPUs, APUs, chipsets for desktops and notebooks, discrete GPUs, and semi-custom SoC products and development services. Embedded segment includes embedded CPUs, GPUs, APUs, FPGAs, system on modules (SOMs), and Adaptive SoC products. The company markets and sells its products under the AMD trademark. Its products include AMD EPYC, AMD Ryzen, AMD Ryzen PRO, Virtex UltraScale+, and others.
Advanced Micro Devices, Inc. engages in the provision of semiconductor businesses. The company is headquartered in Santa Clara, California and currently employs 31,000 full-time employees. The firm is focused on high-performance computing, graphics and visualization technologies. Its segments include Data Center, Client and Gaming, and Embedded. Data Center segment includes artificial intelligence (AI) accelerators, microprocessors (CPUs) for servers, graphics processing units (GPUs), accelerated processing units (APUs), data processing units (DPUs), Field Programmable Gate Arrays (FPGAs), smart network interface Cards (SmartNICs) and Adaptive system-on-Chip (SoC) products for data centers. Client and Gaming segment includes CPUs, APUs, chipsets for desktops and notebooks, discrete GPUs, and semi-custom SoC products and development services. Embedded segment includes embedded CPUs, GPUs, APUs, FPGAs, system on modules (SOMs), and Adaptive SoC products. The company markets and sells its products under the AMD trademark. Its products include AMD EPYC, AMD Ryzen, AMD Ryzen PRO, Virtex UltraScale+, and others.
IPO: 1979-10-15
ADVANCED MICRO DEVICES
2485 Augustine Drive
Santa Clara CALIFORNIA 95054 US
CEO: Lisa T. Su
Employees: 31000
Phone: 13026587581
Advanced Micro Devices, Inc. engages in the provision of semiconductor businesses. The company is headquartered in Santa Clara, California and currently employs 31,000 full-time employees. The firm is focused on high-performance computing, graphics and visualization technologies. Its segments include Data Center, Client and Gaming, and Embedded. Data Center segment includes artificial intelligence (AI) accelerators, microprocessors (CPUs) for servers, graphics processing units (GPUs), accelerated processing units (APUs), data processing units (DPUs), Field Programmable Gate Arrays (FPGAs), smart network interface Cards (SmartNICs) and Adaptive system-on-Chip (SoC) products for data centers. Client and Gaming segment includes CPUs, APUs, chipsets for desktops and notebooks, discrete GPUs, and semi-custom SoC products and development services. Embedded segment includes embedded CPUs, GPUs, APUs, FPGAs, system on modules (SOMs), and Adaptive SoC products. The company markets and sells its products under the AMD trademark. Its products include AMD EPYC, AMD Ryzen, AMD Ryzen PRO, Virtex UltraScale+, and others.
The current stock price of AMD is 323.21 USD. The price decreased by -3.41% in the last trading session.
AMD does not pay a dividend.
AMD has a ChartMill Technical rating of 10 out of 10 and a ChartMill Fundamental rating of 6 out of 10.
The PE ratio for ADVANCED MICRO DEVICES (AMD) is 77.51. This is based on the reported non-GAAP earnings per share of 4.17 and the current share price of 323.21 USD.
ADVANCED MICRO DEVICES (AMD) has a market capitalization of 526.94B USD. This makes AMD a Mega Cap stock.