NASDAQ:HALO appears to be flying under the radar despite its strong fundamentals.
By Mill Chart
Last update: Feb 17, 2025
HALOZYME THERAPEUTICS INC (NASDAQ:HALO) has caught the attention of our stock screener as a great value stock. NASDAQ:HALO excels in profitability, solvency, and liquidity, all while being very reasonably priced. Let's delve into the details.
How We Gauge Valuation for NASDAQ:HALO
ChartMill provides a Valuation Rating to every stock, ranging from 0 to 10. This rating assesses various valuation aspects, comparing price to earnings and cash flows, while considering factors like profitability and growth. NASDAQ:HALO boasts a 9 out of 10:
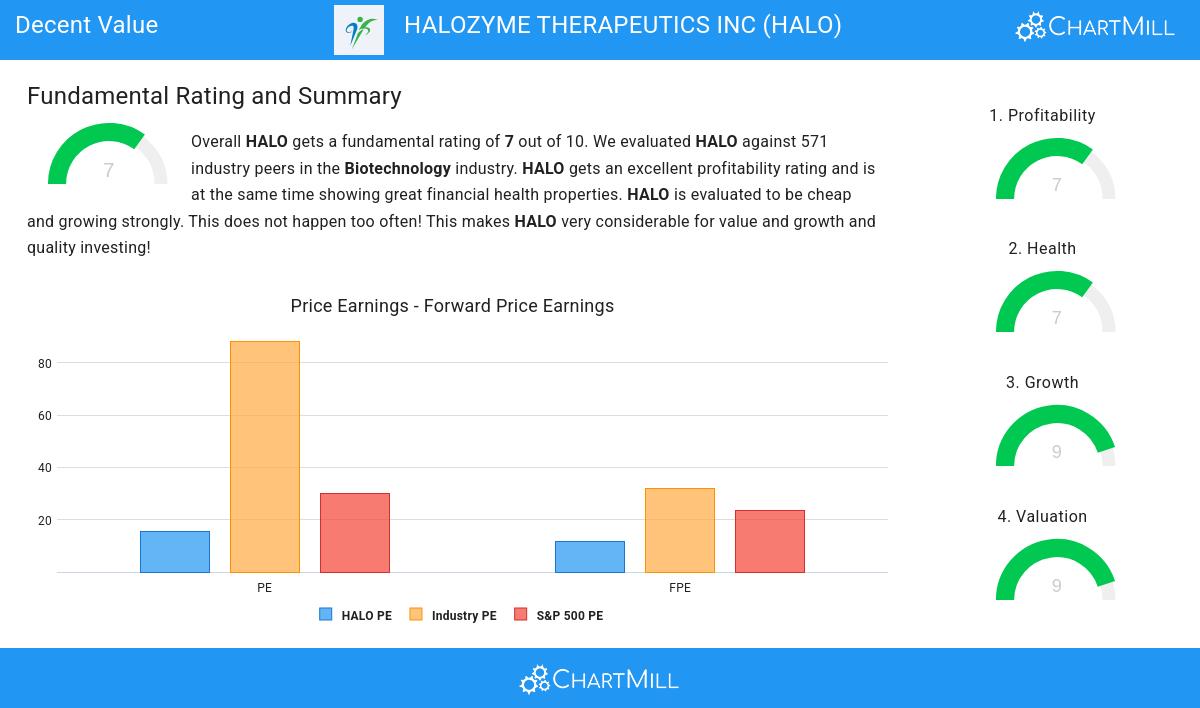
- Based on the Price/Earnings ratio, HALO is valued cheaply inside the industry as 96.45% of the companies are valued more expensively.
- Compared to an average S&P500 Price/Earnings ratio of 30.11, HALO is valued a bit cheaper.
- A Price/Forward Earnings ratio of 11.66 indicates a reasonable valuation of HALO.
- 97.34% of the companies in the same industry are more expensive than HALO, based on the Price/Forward Earnings ratio.
- Compared to an average S&P500 Price/Forward Earnings ratio of 23.58, HALO is valued rather cheaply.
- HALO's Enterprise Value to EBITDA ratio is rather cheap when compared to the industry. HALO is cheaper than 96.80% of the companies in the same industry.
- Compared to the rest of the industry, the Price/Free Cash Flow ratio of HALO indicates a rather cheap valuation: HALO is cheaper than 96.63% of the companies listed in the same industry.
- The low PEG Ratio(NY), which compensates the Price/Earnings for growth, indicates a rather cheap valuation of the company.
- HALO has a very decent profitability rating, which may justify a higher PE ratio.
- HALO's earnings are expected to grow with 32.61% in the coming years. This may justify a more expensive valuation.
Understanding NASDAQ:HALO's Profitability
ChartMill's Profitability Rating offers a unique perspective on stock analysis, providing scores from 0 to 10. These ratings consider a wide range of profitability metrics and margins, both in comparison to industry peers and on their own merits. For NASDAQ:HALO, the assigned 7 is a significant indicator of profitability:
- HALO's Return On Assets of 18.53% is amongst the best of the industry. HALO outperforms 98.76% of its industry peers.
- HALO's Return On Equity of 86.69% is amongst the best of the industry. HALO outperforms 99.82% of its industry peers.
- HALO has a Return On Invested Capital of 19.23%. This is amongst the best in the industry. HALO outperforms 98.05% of its industry peers.
- HALO had an Average Return On Invested Capital over the past 3 years of 17.78%. This is above the industry average of 13.79%.
- The 3 year average ROIC (17.78%) for HALO is below the current ROIC(19.23%), indicating increased profibility in the last year.
- HALO has a Profit Margin of 41.43%. This is amongst the best in the industry. HALO outperforms 98.93% of its industry peers.
- HALO has a Operating Margin of 50.35%. This is amongst the best in the industry. HALO outperforms 100.00% of its industry peers.
- HALO's Gross Margin of 82.09% is amongst the best of the industry. HALO outperforms 87.39% of its industry peers.
Health Insights: NASDAQ:HALO
ChartMill employs a unique Health Rating system for all stocks. This rating, ranging from 0 to 10, is determined by analyzing various liquidity and solvency ratios. For NASDAQ:HALO, the assigned 7 for health provides valuable insights:
- HALO has an Altman-Z score of 4.70. This indicates that HALO is financially healthy and has little risk of bankruptcy at the moment.
- The Altman-Z score of HALO (4.70) is better than 79.40% of its industry peers.
- The Debt to FCF ratio of HALO is 3.83, which is a good value as it means it would take HALO, 3.83 years of fcf income to pay off all of its debts.
- Looking at the Debt to FCF ratio, with a value of 3.83, HALO belongs to the top of the industry, outperforming 94.14% of the companies in the same industry.
- HALO has a Current Ratio of 10.36. This indicates that HALO is financially healthy and has no problem in meeting its short term obligations.
- Looking at the Current ratio, with a value of 10.36, HALO belongs to the top of the industry, outperforming 81.17% of the companies in the same industry.
- HALO has a Quick Ratio of 9.15. This indicates that HALO is financially healthy and has no problem in meeting its short term obligations.
- With a decent Quick ratio value of 9.15, HALO is doing good in the industry, outperforming 77.09% of the companies in the same industry.
Growth Analysis for NASDAQ:HALO
Every stock receives a Growth Rating from ChartMill, ranging from 0 to 10. This rating assesses various growth aspects, including historical and projected EPS and revenue growth. NASDAQ:HALO boasts a 9 out of 10:
- The Earnings Per Share has grown by an impressive 55.33% over the past year.
- The Earnings Per Share has been growing by 45.64% on average over the past years. This is a very strong growth
- HALO shows a strong growth in Revenue. In the last year, the Revenue has grown by 21.36%.
- Measured over the past years, HALO shows a very strong growth in Revenue. The Revenue has been growing by 40.42% on average per year.
- Based on estimates for the next years, HALO will show a very strong growth in Earnings Per Share. The EPS will grow by 27.06% on average per year.
- The Revenue is expected to grow by 17.06% on average over the next years. This is quite good.
Every day, new Decent Value stocks can be found on ChartMill in our Decent Value screener.
For an up to date full fundamental analysis you can check the fundamental report of HALO
Keep in mind
This is not investing advice! The article highlights some of the observations at the time of writing, but you should always make your own analysis and invest based on your own insights.
NASDAQ:HALO (2/20/2025, 1:34:48 PM)
56.35
-1.42 (-2.46%)
Find more stocks in the Stock Screener
HALO Latest News and Analysis
 3 days ago - ChartmillNASDAQ:HALO is not too expensive for the growth it is showing.
HALOZYME THERAPEUTICS INC could be undervalued. NASDAQ:HALO is scoring impressively in terms of growth while demonstrating strong financials. On top of that, it remains attractively priced.
 3 days ago - ChartmillNASDAQ:HALO appears to be flying under the radar despite its strong fundamentals.
Discover HALOZYME THERAPEUTICS INC, an undervalued stock. NASDAQ:HALO showcases solid financial health and profitability while maintaining an appealing valuation.
 17 days ago - ChartmillHALOZYME THERAPEUTICS INC (NASDAQ:HALO) is a candidate for high growth investors. Here's why.
A fundamental and technical analysis of (NASDAQ:HALO): HALOZYME THERAPEUTICS INC (NASDAQ:HALO) may be suited for high growth investing, we'll explore why in this article.
 17 days ago - ChartmillNASDAQ:HALO—A High-Growth Stock Gearing Up for Its Next Upward Move.
Based on fundamental and technical analysis of NASDAQ:HALO we ask: Why HALOZYME THERAPEUTICS INC (NASDAQ:HALO) Is a Standout High-Growth Stock in a Consolidation Phase.
