NASDAQ:HALO is not too expensive for the growth it is showing.
By Mill Chart
Last update: Feb 17, 2025
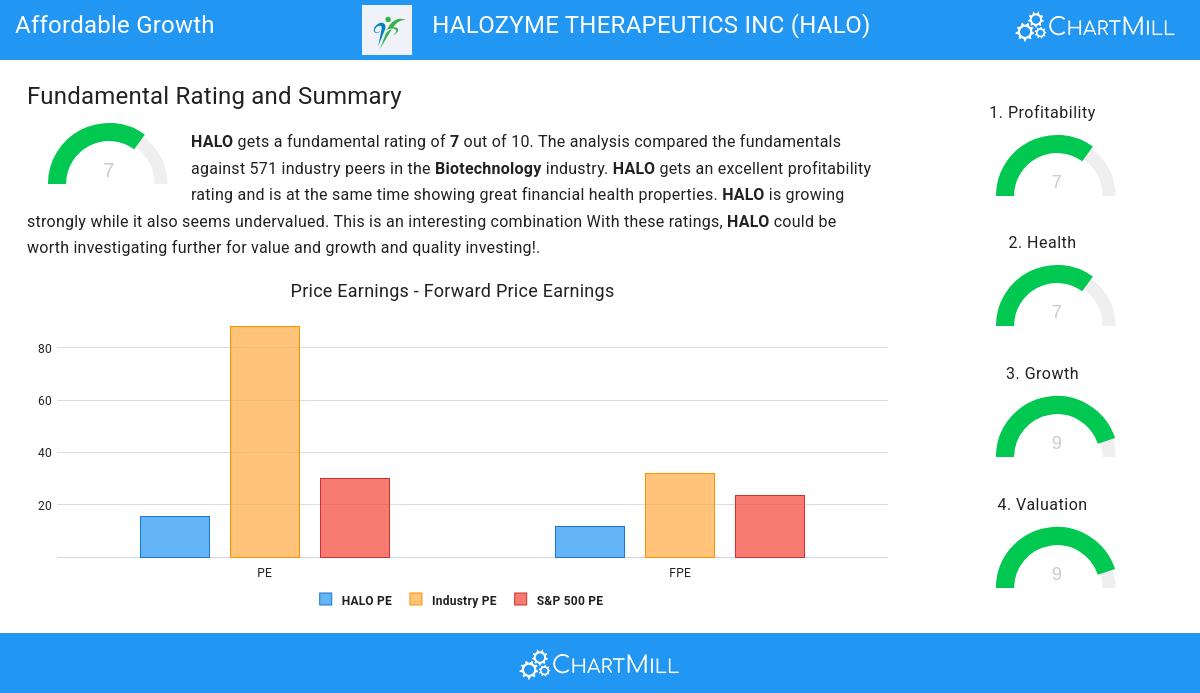
HALOZYME THERAPEUTICS INC (NASDAQ:HALO) has caught the eye of our stock screener as an affordable growth stock. NASDAQ:HALO is displaying robust growth metrics and also excels in terms of profitability, solvency, and liquidity. Additionally, it appears to be reasonably priced. Let's delve into the details.
Assessing Growth for NASDAQ:HALO
ChartMill assigns a Growth Rating to each stock, ranging from 0 to 10. This rating is determined by analyzing different growth elements, including EPS and revenue growth, spanning both historical and future figures. In the case of NASDAQ:HALO, the assigned 9 reflects its growth potential:
- The Earnings Per Share has grown by an impressive 55.33% over the past year.
- The Earnings Per Share has been growing by 45.64% on average over the past years. This is a very strong growth
- HALO shows a strong growth in Revenue. In the last year, the Revenue has grown by 21.36%.
- Measured over the past years, HALO shows a very strong growth in Revenue. The Revenue has been growing by 40.42% on average per year.
- The Earnings Per Share is expected to grow by 27.06% on average over the next years. This is a very strong growth
- The Revenue is expected to grow by 17.06% on average over the next years. This is quite good.
Valuation Assessment of NASDAQ:HALO
An integral part of ChartMill's stock analysis is the Valuation Rating, which spans from 0 to 10. This rating evaluates diverse valuation factors, including price to earnings and cash flows, while considering the stock's profitability and growth. NASDAQ:HALO has received a 9 out of 10:
- HALO's Price/Earnings ratio is rather cheap when compared to the industry. HALO is cheaper than 96.45% of the companies in the same industry.
- HALO's Price/Earnings ratio indicates a valuation a bit cheaper than the S&P500 average which is at 30.11.
- A Price/Forward Earnings ratio of 11.66 indicates a reasonable valuation of HALO.
- 97.34% of the companies in the same industry are more expensive than HALO, based on the Price/Forward Earnings ratio.
- Compared to an average S&P500 Price/Forward Earnings ratio of 23.58, HALO is valued rather cheaply.
- 96.80% of the companies in the same industry are more expensive than HALO, based on the Enterprise Value to EBITDA ratio.
- HALO's Price/Free Cash Flow ratio is rather cheap when compared to the industry. HALO is cheaper than 96.63% of the companies in the same industry.
- The low PEG Ratio(NY), which compensates the Price/Earnings for growth, indicates a rather cheap valuation of the company.
- HALO has a very decent profitability rating, which may justify a higher PE ratio.
- A more expensive valuation may be justified as HALO's earnings are expected to grow with 32.61% in the coming years.
Exploring NASDAQ:HALO's Health
ChartMill employs its own Health Rating for stock assessment. This rating, ranging from 0 to 10, is calculated by examining various liquidity and solvency ratios. In the case of NASDAQ:HALO, the assigned 7 reflects its health status:
- An Altman-Z score of 4.70 indicates that HALO is not in any danger for bankruptcy at the moment.
- The Altman-Z score of HALO (4.70) is better than 79.40% of its industry peers.
- The Debt to FCF ratio of HALO is 3.83, which is a good value as it means it would take HALO, 3.83 years of fcf income to pay off all of its debts.
- Looking at the Debt to FCF ratio, with a value of 3.83, HALO belongs to the top of the industry, outperforming 94.14% of the companies in the same industry.
- A Current Ratio of 10.36 indicates that HALO has no problem at all paying its short term obligations.
- HALO has a Current ratio of 10.36. This is amongst the best in the industry. HALO outperforms 81.17% of its industry peers.
- A Quick Ratio of 9.15 indicates that HALO has no problem at all paying its short term obligations.
- With a decent Quick ratio value of 9.15, HALO is doing good in the industry, outperforming 77.09% of the companies in the same industry.
Profitability Assessment of NASDAQ:HALO
ChartMill employs its own Profitability Rating system for stock evaluation. This score, ranging from 0 to 10, is derived from an analysis of diverse profitability metrics and margins. In the case of NASDAQ:HALO, the assigned 7 is noteworthy for profitability:
- HALO's Return On Assets of 18.53% is amongst the best of the industry. HALO outperforms 98.76% of its industry peers.
- HALO has a Return On Equity of 86.69%. This is amongst the best in the industry. HALO outperforms 99.82% of its industry peers.
- Looking at the Return On Invested Capital, with a value of 19.23%, HALO belongs to the top of the industry, outperforming 98.05% of the companies in the same industry.
- HALO had an Average Return On Invested Capital over the past 3 years of 17.78%. This is above the industry average of 13.79%.
- The last Return On Invested Capital (19.23%) for HALO is above the 3 year average (17.78%), which is a sign of increasing profitability.
- HALO has a Profit Margin of 41.43%. This is amongst the best in the industry. HALO outperforms 98.93% of its industry peers.
- HALO has a Operating Margin of 50.35%. This is amongst the best in the industry. HALO outperforms 100.00% of its industry peers.
- The Gross Margin of HALO (82.09%) is better than 87.39% of its industry peers.
Our Affordable Growth screener lists more Affordable Growth stocks and is updated daily.
For an up to date full fundamental analysis you can check the fundamental report of HALO
Keep in mind
Important Note: The content of this article is not intended as trading advice. It is essential to perform your own analysis and exercise caution when making trading decisions. The article presents observations created by automated analysis but does not guarantee any trading or investment outcomes. Always trade responsibly and make independent judgments.
60.49
+1.24 (+2.09%)
Find more stocks in the Stock Screener
HALO Latest News and Analysis
 a day ago - ChartmillWhile growth is established for HALOZYME THERAPEUTICS INC (NASDAQ:HALO), the stock's valuation remains reasonable.
HALOZYME THERAPEUTICS INC was identified as an affordable growth stock. NASDAQ:HALO is showing great growth, but also scores well on profitability. At the same time it seems to be priced reasonably.
 9 days ago - ChartmillHALOZYME THERAPEUTICS INC (NASDAQ:HALO), a strong growth stock, setting up for a breakout.
Based on a technical and fundamental analysis of NASDAQ:HALO we conclude: HALOZYME THERAPEUTICS INC (NASDAQ:HALO)—A High-Growth Stock Gearing Up for Its Next Upward Move.
 17 days ago - ChartmillInvestors should take notice of HALOZYME THERAPEUTICS INC (NASDAQ:HALO)—it offers a great deal for the fundamentals it presents.
HALOZYME THERAPEUTICS INC is a hidden gem, featuring undervaluation and robust fundamentals. NASDAQ:HALO showcases decent financial health and profitability, coupled with an attractive price.
