NASDAQ:HALO—A High-Growth Stock Gearing Up for Its Next Upward Move.
By Mill Chart
Last update: Feb 3, 2025
Groth investors are looking for stocks showing high revenue and EPS growth. We will have a look here to see if HALOZYME THERAPEUTICS INC (NASDAQ:HALO) is suited for growth investing, while it is forming a base and may be ready to breakout. Investors should of course do their own research, but we spotted HALOZYME THERAPEUTICS INC showing up in our growth with base formation screen, so it may be worth spending some more time on it.
Analyzing Growth Metrics
ChartMill assigns a Growth Rating to every stock. This score ranges from 0 to 10 and evaluates the different growth aspects like EPS and Revenue, both in the past as in the future. NASDAQ:HALO scores a 9 out of 10:
- HALO shows a strong growth in Earnings Per Share. In the last year, the EPS has been growing by 55.33%, which is quite impressive.
- Measured over the past years, HALO shows a very strong growth in Earnings Per Share. The EPS has been growing by 45.64% on average per year.
- The Revenue has grown by 21.36% in the past year. This is a very strong growth!
- HALO shows a strong growth in Revenue. Measured over the last years, the Revenue has been growing by 40.42% yearly.
- The Earnings Per Share is expected to grow by 27.06% on average over the next years. This is a very strong growth
- Based on estimates for the next years, HALO will show a quite strong growth in Revenue. The Revenue will grow by 17.06% on average per year.
Health Analysis for NASDAQ:HALO
ChartMill employs a unique Health Rating system for all stocks. This rating, ranging from 0 to 10, is determined by analyzing various liquidity and solvency ratios. For NASDAQ:HALO, the assigned 7 for health provides valuable insights:
- An Altman-Z score of 4.63 indicates that HALO is not in any danger for bankruptcy at the moment.
- Looking at the Altman-Z score, with a value of 4.63, HALO is in the better half of the industry, outperforming 79.65% of the companies in the same industry.
- HALO has a debt to FCF ratio of 3.83. This is a good value and a sign of high solvency as HALO would need 3.83 years to pay back of all of its debts.
- HALO has a better Debt to FCF ratio (3.83) than 94.16% of its industry peers.
- HALO has a Current Ratio of 10.36. This indicates that HALO is financially healthy and has no problem in meeting its short term obligations.
- HALO has a better Current ratio (10.36) than 81.77% of its industry peers.
- HALO has a Quick Ratio of 9.15. This indicates that HALO is financially healthy and has no problem in meeting its short term obligations.
- The Quick ratio of HALO (9.15) is better than 77.52% of its industry peers.
A Closer Look at Profitability for NASDAQ:HALO
ChartMill assigns a Profitability Rating to every stock. This score ranges from 0 to 10 and evaluates the different profitability ratios and margins, both absolutely, but also relative to the industry peers. NASDAQ:HALO scores a 7 out of 10:
- HALO's Return On Assets of 18.53% is amongst the best of the industry. HALO outperforms 98.58% of its industry peers.
- Looking at the Return On Equity, with a value of 86.69%, HALO belongs to the top of the industry, outperforming 99.65% of the companies in the same industry.
- Looking at the Return On Invested Capital, with a value of 19.23%, HALO belongs to the top of the industry, outperforming 98.05% of the companies in the same industry.
- HALO had an Average Return On Invested Capital over the past 3 years of 17.78%. This is above the industry average of 13.85%.
- The last Return On Invested Capital (19.23%) for HALO is above the 3 year average (17.78%), which is a sign of increasing profitability.
- With an excellent Profit Margin value of 41.43%, HALO belongs to the best of the industry, outperforming 98.76% of the companies in the same industry.
- The Operating Margin of HALO (50.35%) is better than 100.00% of its industry peers.
- HALO has a Gross Margin of 82.09%. This is amongst the best in the industry. HALO outperforms 87.26% of its industry peers.
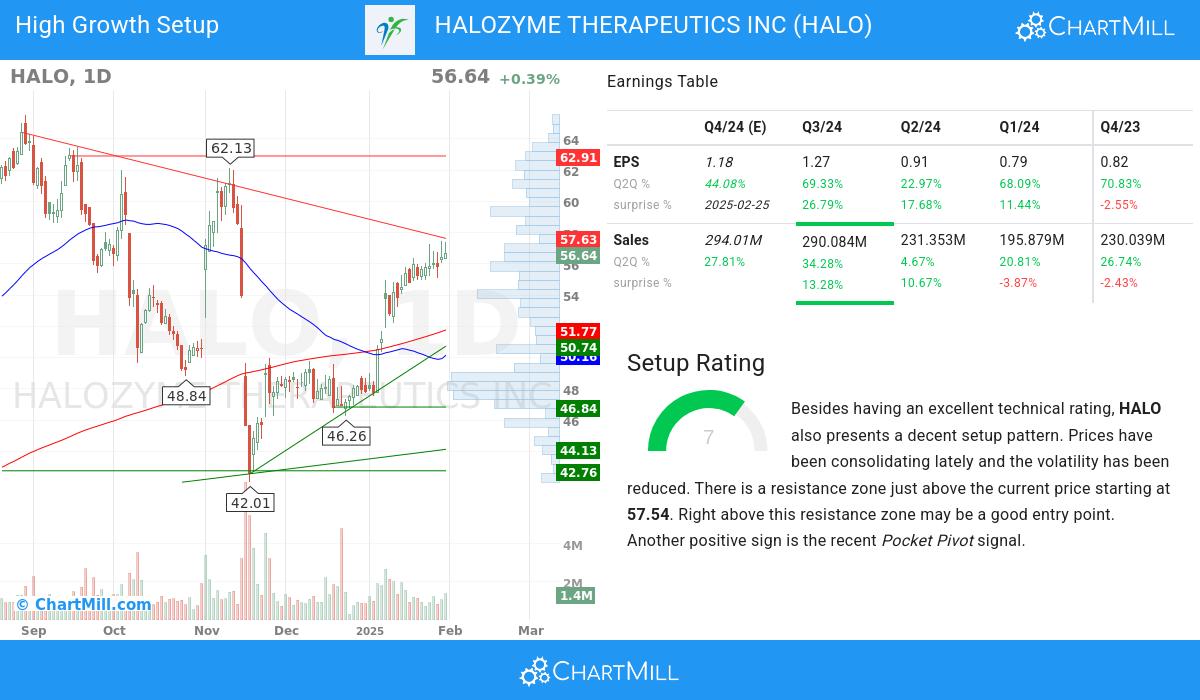
How does the Setup look for NASDAQ:HALO
ChartMill takes into account not only the Technical Rating but also assigns a Setup Rating to each stock. This rating, on a scale of 0 to 10, reflects the degree of consolidation observed based on short-term technical indicators. Currently, NASDAQ:HALO exhibits a 7 setup rating, indicating its consolidation status in recent days and weeks.
HALO has an excellent technical rating and also presents a decent setup pattern. We see reduced volatility while prices have been consolidating in the most recent period. There is a resistance zone just above the current price starting at 57.54. Right above this resistance zone may be a good entry point. Very recently a Pocket Pivot signal was observed. This is another positive sign.
More Strong Growth stocks can be found in our Strong Growth screener.
Our latest full fundamental report of HALO contains the most current fundamental analsysis.
Check the latest full technical report of HALO for a complete technical analysis.
Keep in mind
This article should in no way be interpreted as advice. The article is based on the observed metrics at the time of writing, but you should always make your own analysis and trade or invest at your own responsibility.
60.49
+1.24 (+2.09%)
Find more stocks in the Stock Screener
HALO Latest News and Analysis
 8 hours ago - ChartmillWhile growth is established for HALOZYME THERAPEUTICS INC (NASDAQ:HALO), the stock's valuation remains reasonable.
HALOZYME THERAPEUTICS INC was identified as an affordable growth stock. NASDAQ:HALO is showing great growth, but also scores well on profitability. At the same time it seems to be priced reasonably.
 8 days ago - ChartmillHALOZYME THERAPEUTICS INC (NASDAQ:HALO), a strong growth stock, setting up for a breakout.
Based on a technical and fundamental analysis of NASDAQ:HALO we conclude: HALOZYME THERAPEUTICS INC (NASDAQ:HALO)—A High-Growth Stock Gearing Up for Its Next Upward Move.
 16 days ago - ChartmillInvestors should take notice of HALOZYME THERAPEUTICS INC (NASDAQ:HALO)—it offers a great deal for the fundamentals it presents.
HALOZYME THERAPEUTICS INC is a hidden gem, featuring undervaluation and robust fundamentals. NASDAQ:HALO showcases decent financial health and profitability, coupled with an attractive price.
