
Mark Minervini Strategy | Think and Trade Like a Champion Part 2 | Trading Strategy
Mark Minervini Strategy to Achieve Superperformance in Stocks in Any Market
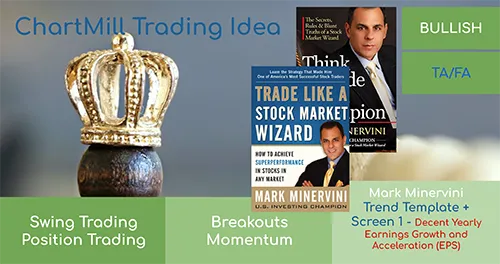
Trend Template + Decent Yearly Earnings Growth and Acceleration (EPS)
Mark Minervini Strategy to Achieve Superperformance in Stocks in Any Market

This article describes our CANSLIM base screen.

An overview of the best stock screener filters, settings and criteria for Growth Investing

A description of the fundamental filters related to stock growth, like EPS and revenue growth.

The criteria described by Martin Zweig find growth stocks at reasonable prices, also known at the GARP style. We will discuss the rules of the stock screener in this article.

An overview of the investment rules and strategy by Peter Lynch as described in the book One Up On Wall Street and the implementation in the stock screener.

The ChartMill High Growth Momentum Rating evaluates different aspects of a high growth momentum stock and summarizes it into a single rating
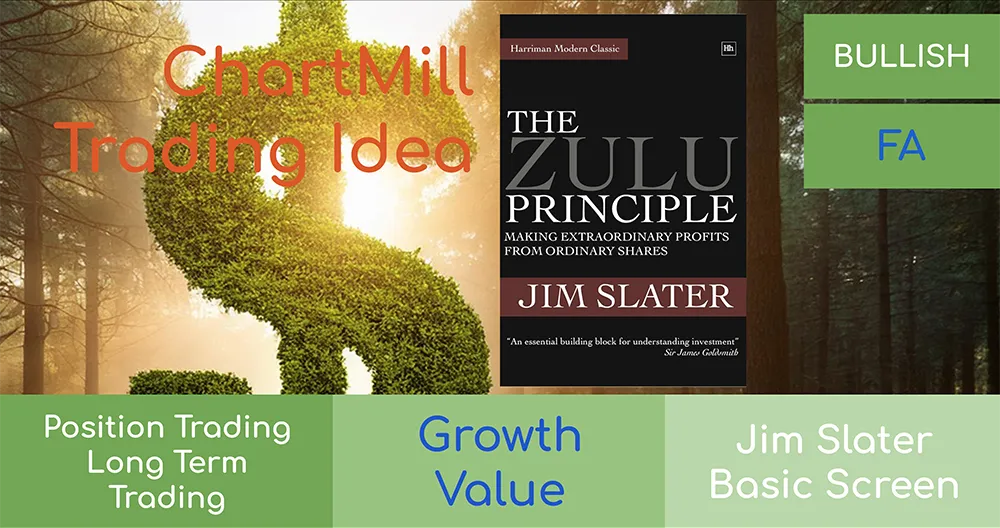
Making Extraordinary Profits from Ordinary Shares

Mark Minervini, two-time U.S. Investing Champion, uses a strategy that combines both technical and fundamental analysis with tremendous attention to risk management as the key to long-term success.

Stocks that are expected to grow significantly faster than their sector peers and the overall market average are considered growth stocks. Investors who invest in growth stocks do so specifically because they expect the price of the stock to rise exponent

A stock screener based on the rules and strategy described in the book "The little book that makes you rich", by Louis Navellier.
Weekly setup- and watchlist before market opening. The screening is done based on last Friday's closing prices.
How I use the different Minervini screens to find stocks that meet the criteria for this trading strategy and how they are further analyzed to arrive at real setups is covered in this video.
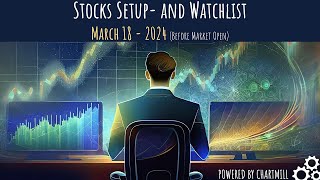
My current setup- and watchlist before market opening. The screening is done based on last Friday's closing prices.

Growth Stocks are expected to grow significantly faster than their sector peers and the overall market average. Investors who invest in growth stocks do so because they expect these companies to become the next industry leaders, allowing for large exponential price gains.
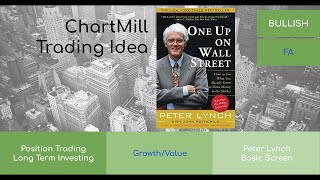
"One Up on Wall Street" is a highly regarded investment book written by Peter Lynch, a renowned investor and former fund manager. Published in 1989, the book provides valuable insights into Lynch's successful investment strategies and offers guidance on how to identify profitable investment opportunities.

In this video, we discuss some Mark Minervini screens we recently added in ChartMill based on two books by Mark Minervini, two-time US Investing Champion (1997 and 2021).
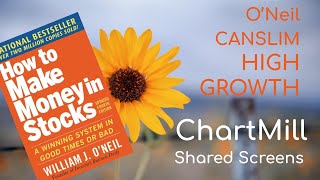
Finding High Growth Market Leaders is a popular strategy. However, spotting these specific stocks is not easy. In this video, I show you how to quickly and accurately create a basic first list of stocks to consider using the O'Neill CANSLIM Trading Idea by ChartMill. The parameters used come from the book "How to Make Money in Stocks: A Winning System in Good Times and Bad" by William O'Neil. The book was first published in 1988 and has been revised repeatedly since then. In the book, fundamental criteria are used to determine which stocks meet the requirements, technical criteria combined with a general analysis of market direction further determine when to buy the stock.
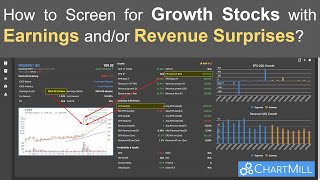
Growth stocks with strong quarterly earnings and revenue results are popular among swing traders, especially when the results are (much) better than what analysts expected. ChartMill allows you to specifically screen for stocks with such earnings or revenue surprises. In this video I show you exactly how to do that.
The Little Book That Makes You Rich is a beginners guide to investing in the stock market, with a focus on growth investing. The author, Louis Navellier, provides a framework for identifying and investing in high-growth companies, and offers insights on how to build a diversified portfolio. The book also includes information on market trends and strategies for managing risk. It is one of several books Navellier has written on investing and personal finance. ChartMill has translated the rules in the book into a trading idea that allows you to look for stocks that meet the selection criteria.
The High Growth Momentum Rating Filter This new filter is designed to help you identify stocks with outstanding growth potential by analyzing key performance indicators.
In this video i share my daily ChartMill swing trading workflow , using the Minervini Screening Filters.
Solid Relative Strength
Decent liquidity
Decent earnings growth long-term
Long-term price trend up
Current high within 25% of 52-week high
Only US stocks
Short-term trend positive 2
Long-term trend bullish
Medium-term trend positive
Current close at least 30% higher than 52-week low
Medium-term price trend up
Short-term trend positive 1
Decent earnings growth acceleration last year
Short-term price trend up
Daily timeframe
Run this screen in your favorite region. You can always further fine tune the screen by changing the general settings after it opened in the screener.