
In a market where value is scarce, NYSE:ZTO offers a refreshing opportunity with its solid fundamentals.
By Mill Chart
Last update: Sep 16, 2024
Our stock screening tool has identified ZTO EXPRESS CAYMAN INC-ADR (NYSE:ZTO) as an undervalued gem with strong fundamentals. NYSE:ZTO boasts decent financial health and profitability while maintaining an attractive price point. We'll break it down further.
Unpacking NYSE:ZTO's Valuation Rating
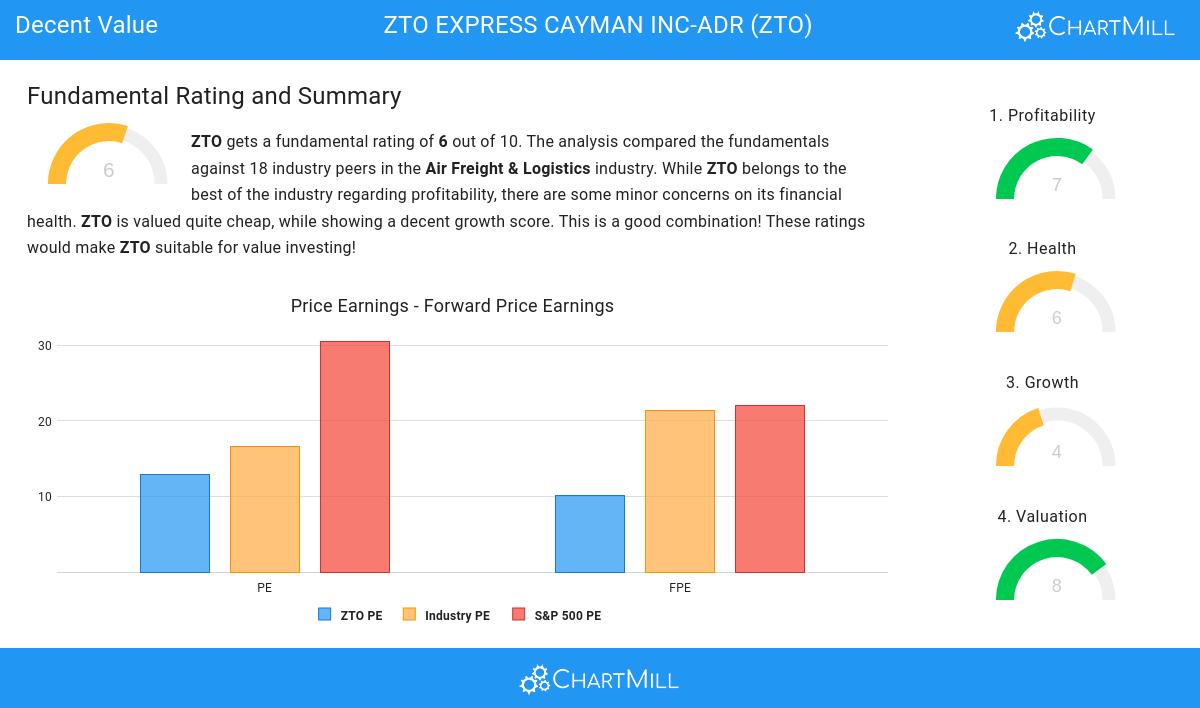
ChartMill provides a Valuation Rating to every stock, ranging from 0 to 10. This rating assesses various valuation aspects, comparing price to earnings and cash flows, while considering factors like profitability and growth. NYSE:ZTO boasts a 8 out of 10:
- Compared to the rest of the industry, the Price/Earnings ratio of ZTO indicates a somewhat cheap valuation: ZTO is cheaper than 77.78% of the companies listed in the same industry.
- When comparing the Price/Earnings ratio of ZTO to the average of the S&P500 Index (30.52), we can say ZTO is valued rather cheaply.
- Based on the Price/Forward Earnings ratio of 10.16, the valuation of ZTO can be described as reasonable.
- ZTO's Price/Forward Earnings ratio is rather cheap when compared to the industry. ZTO is cheaper than 100.00% of the companies in the same industry.
- The average S&P500 Price/Forward Earnings ratio is at 21.99. ZTO is valued rather cheaply when compared to this.
- ZTO's Enterprise Value to EBITDA ratio is rather cheap when compared to the industry. ZTO is cheaper than 83.33% of the companies in the same industry.
- 72.22% of the companies in the same industry are more expensive than ZTO, based on the Price/Free Cash Flow ratio.
- ZTO's low PEG Ratio(NY), which compensates the Price/Earnings for growth, indicates a rather cheap valuation of the company.
- ZTO has a very decent profitability rating, which may justify a higher PE ratio.
- ZTO's earnings are expected to grow with 16.60% in the coming years. This may justify a more expensive valuation.
Exploring NYSE:ZTO's Profitability
ChartMill employs its own Profitability Rating system for stock evaluation. This score, ranging from 0 to 10, is derived from an analysis of diverse profitability metrics and margins. In the case of NYSE:ZTO, the assigned 7 is noteworthy for profitability:
- Looking at the Return On Assets, with a value of 9.41%, ZTO belongs to the top of the industry, outperforming 83.33% of the companies in the same industry.
- ZTO's Return On Equity of 14.19% is fine compared to the rest of the industry. ZTO outperforms 72.22% of its industry peers.
- Looking at the Return On Invested Capital, with a value of 10.88%, ZTO is in the better half of the industry, outperforming 77.78% of the companies in the same industry.
- The 3 year average ROIC (9.42%) for ZTO is below the current ROIC(10.88%), indicating increased profibility in the last year.
- ZTO has a Profit Margin of 21.24%. This is amongst the best in the industry. ZTO outperforms 100.00% of its industry peers.
- ZTO's Operating Margin of 26.40% is amongst the best of the industry. ZTO outperforms 100.00% of its industry peers.
- With a decent Gross Margin value of 30.85%, ZTO is doing good in the industry, outperforming 66.67% of the companies in the same industry.
How do we evaluate the Health for NYSE:ZTO?
ChartMill employs its own Health Rating for stock assessment. This rating, ranging from 0 to 10, is calculated by examining various liquidity and solvency ratios. In the case of NYSE:ZTO, the assigned 6 reflects its health status:
- An Altman-Z score of 3.93 indicates that ZTO is not in any danger for bankruptcy at the moment.
- The Altman-Z score of ZTO (3.93) is better than 66.67% of its industry peers.
- ZTO has a debt to FCF ratio of 1.73. This is a very positive value and a sign of high solvency as it would only need 1.73 years to pay back of all of its debts.
- ZTO has a Debt to FCF ratio of 1.73. This is in the better half of the industry: ZTO outperforms 77.78% of its industry peers.
- A Debt/Equity ratio of 0.29 indicates that ZTO is not too dependend on debt financing.
- ZTO has a Debt to Equity ratio of 0.29. This is in the better half of the industry: ZTO outperforms 66.67% of its industry peers.
Growth Assessment of NYSE:ZTO
A key component of ChartMill's stock assessment is the Growth Rating, which spans from 0 to 10. This rating evaluates diverse growth factors, such as EPS and revenue growth, considering both past performance and future projections. NYSE:ZTO has received a 4 out of 10:
- ZTO shows a strong growth in Earnings Per Share. In the last year, the EPS has been growing by 14.68%, which is quite good.
- ZTO shows quite a strong growth in Earnings Per Share. Measured over the last years, the EPS has been growing by 12.36% yearly.
- The Revenue has been growing by 16.89% on average over the past years. This is quite good.
Every day, new Decent Value stocks can be found on ChartMill in our Decent Value screener.
Check the latest full fundamental report of ZTO for a complete fundamental analysis.
Keep in mind
This is not investing advice! The article highlights some of the observations at the time of writing, but you should always make your own analysis and invest based on your own insights.
