
When you look at ZTO EXPRESS CAYMAN INC-ADR (NYSE:ZTO), it's hard to ignore the strong fundamentals, especially considering its likely undervaluation.
By Mill Chart
Last update: Mar 6, 2025
Our stock screener has singled out ZTO EXPRESS CAYMAN INC-ADR (NYSE:ZTO) as a stellar value proposition. NYSE:ZTO not only scores well in profitability, solvency, and liquidity but also maintains a very reasonable price point. We'll explore this further.
Evaluating Valuation: NYSE:ZTO
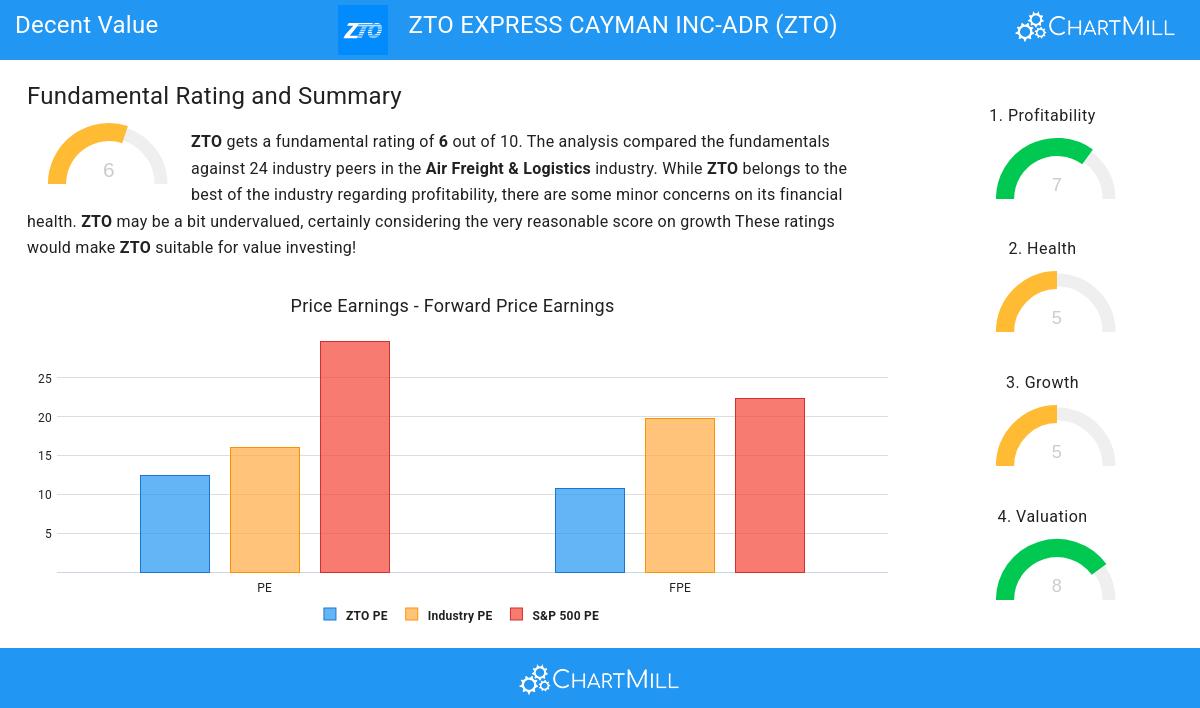
An integral part of ChartMill's stock analysis is the Valuation Rating, which spans from 0 to 10. This rating evaluates diverse valuation factors, including price to earnings and cash flows, while considering the stock's profitability and growth. NYSE:ZTO has received a 8 out of 10:
- ZTO's Price/Earnings ratio is rather cheap when compared to the industry. ZTO is cheaper than 87.50% of the companies in the same industry.
- When comparing the Price/Earnings ratio of ZTO to the average of the S&P500 Index (29.71), we can say ZTO is valued rather cheaply.
- Based on the Price/Forward Earnings ratio of 10.80, the valuation of ZTO can be described as reasonable.
- Compared to the rest of the industry, the Price/Forward Earnings ratio of ZTO indicates a rather cheap valuation: ZTO is cheaper than 95.83% of the companies listed in the same industry.
- Compared to an average S&P500 Price/Forward Earnings ratio of 22.34, ZTO is valued rather cheaply.
- ZTO's Enterprise Value to EBITDA ratio is rather cheap when compared to the industry. ZTO is cheaper than 87.50% of the companies in the same industry.
- Compared to the rest of the industry, the Price/Free Cash Flow ratio of ZTO indicates a rather cheap valuation: ZTO is cheaper than 83.33% of the companies listed in the same industry.
- ZTO's low PEG Ratio(NY), which compensates the Price/Earnings for growth, indicates a rather cheap valuation of the company.
- ZTO has a very decent profitability rating, which may justify a higher PE ratio.
- A more expensive valuation may be justified as ZTO's earnings are expected to grow with 12.59% in the coming years.
Profitability Insights: NYSE:ZTO
ChartMill assigns a proprietary Profitability Rating to each stock. The score is computed by evaluating various profitability ratios and margins and ranges from 0 to 10. NYSE:ZTO was assigned a score of 7 for profitability:
- Looking at the Return On Assets, with a value of 9.24%, ZTO belongs to the top of the industry, outperforming 91.67% of the companies in the same industry.
- ZTO has a Return On Equity of 14.24%. This is in the better half of the industry: ZTO outperforms 79.17% of its industry peers.
- With an excellent Return On Invested Capital value of 12.34%, ZTO belongs to the best of the industry, outperforming 83.33% of the companies in the same industry.
- The 3 year average ROIC (9.42%) for ZTO is below the current ROIC(12.34%), indicating increased profibility in the last year.
- Looking at the Profit Margin, with a value of 20.55%, ZTO belongs to the top of the industry, outperforming 100.00% of the companies in the same industry.
- ZTO has a better Operating Margin (26.39%) than 100.00% of its industry peers.
- ZTO has a better Gross Margin (31.17%) than 75.00% of its industry peers.
Looking at the Health
ChartMill assigns a Health Rating to every stock. This score ranges from 0 to 10 and evaluates the different health aspects like liquidity and solvency, both absolutely, but also relative to the industry peers. NYSE:ZTO scores a 5 out of 10:
- An Altman-Z score of 3.61 indicates that ZTO is not in any danger for bankruptcy at the moment.
- With a decent Altman-Z score value of 3.61, ZTO is doing good in the industry, outperforming 75.00% of the companies in the same industry.
- The Debt to FCF ratio of ZTO is 3.02, which is a good value as it means it would take ZTO, 3.02 years of fcf income to pay off all of its debts.
- Looking at the Debt to FCF ratio, with a value of 3.02, ZTO is in the better half of the industry, outperforming 79.17% of the companies in the same industry.
- A Debt/Equity ratio of 0.18 indicates that ZTO is not too dependend on debt financing.
- With a decent Debt to Equity ratio value of 0.18, ZTO is doing good in the industry, outperforming 70.83% of the companies in the same industry.
Understanding NYSE:ZTO's Growth Score
Every stock receives a Growth Rating from ChartMill, ranging from 0 to 10. This rating assesses various growth aspects, including historical and projected EPS and revenue growth. NYSE:ZTO boasts a 5 out of 10:
- ZTO shows a strong growth in Earnings Per Share. In the last year, the EPS has been growing by 10.14%, which is quite good.
- ZTO shows quite a strong growth in Earnings Per Share. Measured over the last years, the EPS has been growing by 12.36% yearly.
- The Revenue has grown by 11.44% in the past year. This is quite good.
- ZTO shows quite a strong growth in Revenue. Measured over the last years, the Revenue has been growing by 16.89% yearly.
- ZTO is expected to show quite a strong growth in Earnings Per Share. In the coming years, the EPS will grow by 8.34% yearly.
Our Decent Value screener lists more Decent Value stocks and is updated daily.
Our latest full fundamental report of ZTO contains the most current fundamental analsysis.
Keep in mind
This article should in no way be interpreted as advice. The article is based on the observed metrics at the time of writing, but you should always make your own analysis and trade or invest at your own responsibility.
