In the world of growth stocks, NYSE:YOU shines as a value proposition.
By Mill Chart
Last update: Feb 18, 2025
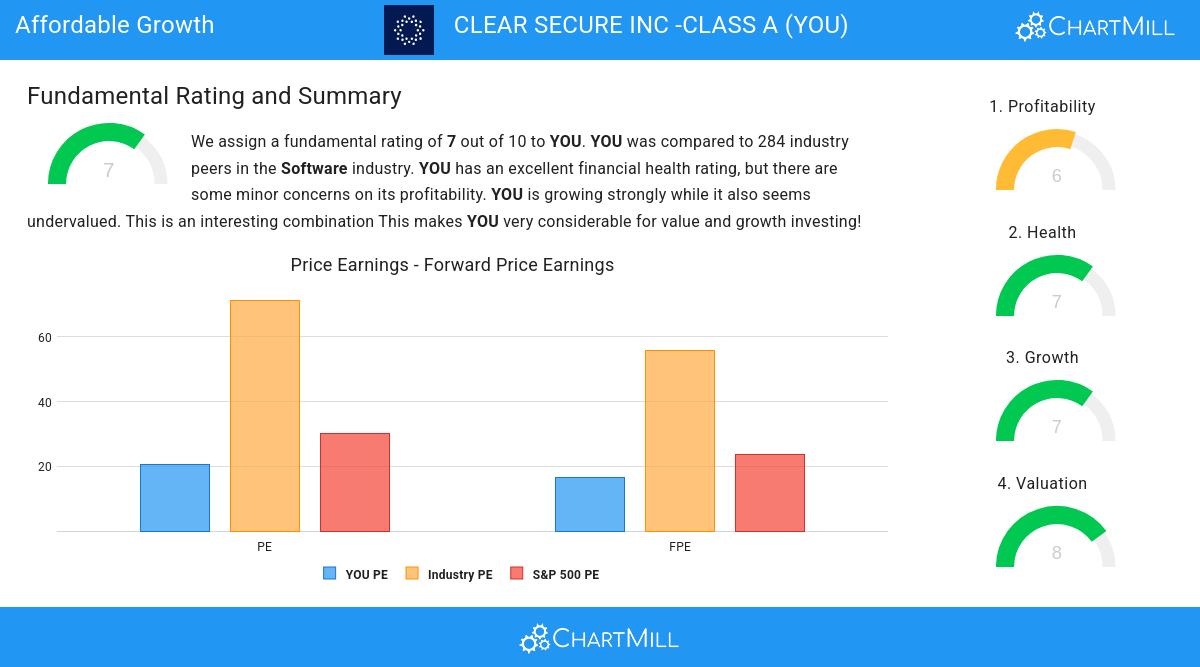
CLEAR SECURE INC -CLASS A (NYSE:YOU) was identified as an affordable growth stock by our stock screener. NYSE:YOU is showing great growth, but also scores well on profitability, solvency and liquidity. At the same time it seems to be priced reasonably. We'll explore this a bit deeper below.
Growth Analysis for NYSE:YOU
To evaluate a stock's growth potential, ChartMill utilizes a Growth Rating on a scale of 0 to 10. This comprehensive assessment considers various growth aspects, including historical and estimated EPS and revenue growth. NYSE:YOU has achieved a 7 out of 10:
- The Earnings Per Share has grown by an impressive 94.64% over the past year.
- YOU shows a strong growth in Revenue. In the last year, the Revenue has grown by 28.75%.
- YOU shows a strong growth in Revenue. Measured over the last years, the Revenue has been growing by 38.53% yearly.
- YOU is expected to show a strong growth in Earnings Per Share. In the coming years, the EPS will grow by 42.15% yearly.
- Based on estimates for the next years, YOU will show a quite strong growth in Revenue. The Revenue will grow by 13.48% on average per year.
Valuation Insights: NYSE:YOU
ChartMill employs its own Valuation Rating system for all stocks. This score, ranging from 0 to 10, is determined by evaluating different valuation factors, including price to earnings and free cash flow, both in absolute terms and relative to the market and industry. NYSE:YOU has earned a 8 for valuation:
- Based on the Price/Earnings ratio, YOU is valued cheaper than 81.88% of the companies in the same industry.
- When comparing the Price/Earnings ratio of YOU to the average of the S&P500 Index (30.19), we can say YOU is valued slightly cheaper.
- 86.59% of the companies in the same industry are more expensive than YOU, based on the Price/Forward Earnings ratio.
- YOU is valuated rather cheaply when we compare the Price/Forward Earnings ratio to 23.58, which is the current average of the S&P500 Index.
- Compared to the rest of the industry, the Enterprise Value to EBITDA ratio of YOU indicates a rather cheap valuation: YOU is cheaper than 87.68% of the companies listed in the same industry.
- Based on the Price/Free Cash Flow ratio, YOU is valued cheaply inside the industry as 92.39% of the companies are valued more expensively.
- The low PEG Ratio(NY), which compensates the Price/Earnings for growth, indicates a rather cheap valuation of the company.
- YOU has a very decent profitability rating, which may justify a higher PE ratio.
- YOU's earnings are expected to grow with 42.15% in the coming years. This may justify a more expensive valuation.
ChartMill's Evaluation of Health
ChartMill employs a unique Health Rating system for all stocks. This rating, ranging from 0 to 10, is determined by analyzing various liquidity and solvency ratios. For NYSE:YOU, the assigned 7 for health provides valuable insights:
- An Altman-Z score of 3.88 indicates that YOU is not in any danger for bankruptcy at the moment.
- There is no outstanding debt for YOU. This means it has a Debt/Equity and Debt/FCF ratio of 0 and it is amongst the best of the sector and industry.
Profitability Analysis for NYSE:YOU
ChartMill assigns a Profitability Rating to every stock. This score ranges from 0 to 10 and evaluates the different profitability ratios and margins, both absolutely, but also relative to the industry peers. NYSE:YOU scores a 6 out of 10:
- With an excellent Return On Assets value of 9.36%, YOU belongs to the best of the industry, outperforming 85.51% of the companies in the same industry.
- Looking at the Return On Equity, with a value of 62.31%, YOU belongs to the top of the industry, outperforming 97.46% of the companies in the same industry.
- YOU has a better Return On Invested Capital (27.28%) than 96.38% of its industry peers.
- YOU's Profit Margin of 10.93% is fine compared to the rest of the industry. YOU outperforms 76.09% of its industry peers.
- YOU has a Operating Margin of 14.14%. This is amongst the best in the industry. YOU outperforms 82.97% of its industry peers.
- YOU has a better Gross Margin (85.52%) than 92.03% of its industry peers.
More Affordable Growth stocks can be found in our Affordable Growth screener.
Check the latest full fundamental report of YOU for a complete fundamental analysis.
Keep in mind
Important Note: The content of this article is not intended as trading advice. It is essential to perform your own analysis and exercise caution when making trading decisions. The article presents observations created by automated analysis but does not guarantee any trading or investment outcomes. Always trade responsibly and make independent judgments.
22.12
-0.83 (-3.62%)
Find more stocks in the Stock Screener
YOU Latest News and Analysis
 2 days ago - ChartmillNYSE:YOU appears to be flying under the radar despite its strong fundamentals.
CLEAR SECURE INC -CLASS A may be an undervalued stock option. NYSE:YOU retains a strong financial foundation and an attractive price tag.
 2 days ago - ChartmillIn the world of growth stocks, NYSE:YOU shines as a value proposition.
Discover CLEAR SECURE INC -CLASS A, an undervalued growth gem. NYSE:YOU is shining in terms of growth metrics, and it's also displaying strong financial health and profitability, retaining an appealing valuation.
