Good technical signals and a possible breakout for VERTEX PHARMACEUTICALS INC (NASDAQ:VRTX).
By Mill Chart
Last update: Mar 4, 2025
We've identified VERTEX PHARMACEUTICALS INC (NASDAQ:VRTX) as a potential breakout candidate based on our stock screener's analysis. This breakout setup pattern suggests that after a strong uptrend, the stock is currently consolidating, potentially signaling a continuation of the trend. Keep an eye on NASDAQ:VRTX for further developments.
Technical analysis of NASDAQ:VRTX
Every day ChartMill assigns a Technical Rating to every stock. The score ranges from 0 to 10 and is determined by evaluating multiple technical indicators and properties.
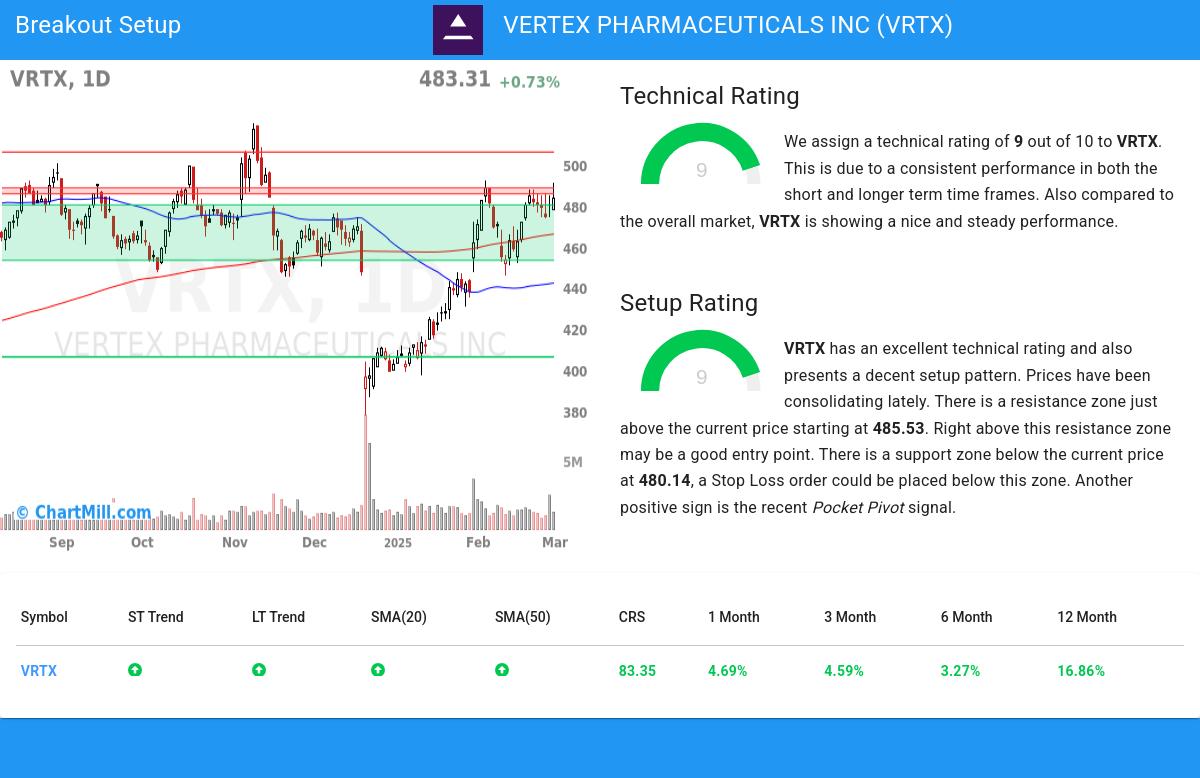
We assign a technical rating of 9 out of 10 to VRTX. This is due to a consistent performance in both the short and longer term time frames. Also compared to the overall market, VRTX is showing a nice and steady performance.
- Both the short term and long term trends are positive. This is a very positive sign.
- VRTX is one of the better performing stocks in the Biotechnology industry, it outperforms 86% of 571 stocks in the same industry.
- VRTX is currently trading in the upper part of its 52 week range. The S&P500 Index is also trading in the upper part of its 52 week range, so VRTX is performing more or less in line with the market.
- In the last month VRTX has a been trading in the 446.00 - 491.81 range, which is quite wide. It is currently trading near the high of this range.
- Prices have been consolidating recently, this may present a good entry opportunity.
- When comparing the yearly performance of all stocks, we notice that VRTX is one of the better performing stocks in the market, outperforming 83% of all stocks. However, this overall performance is mostly based on the strong move around 10 months ago.
Our latest full technical report of VRTX contains the most current technical analsysis.
Why is NASDAQ:VRTX a setup?
Besides the Technical Rating, ChartMill also assign a Setup Rating to every stock. This setup score also ranges from 0 to 10 and determines to which extend the stock is consolidating. This is achieved by evaluating multiple short term technical indicators. NASDAQ:VRTX currently has a 9 as setup rating:
Besides having an excellent technical rating, VRTX also presents a decent setup pattern. Prices have been consolidating lately. There is a resistance zone just above the current price starting at 485.53. Right above this resistance zone may be a good entry point. There is a support zone below the current price at 480.14, a Stop Loss order could be placed below this zone. Very recently a Pocket Pivot signal was observed. This is another positive sign.
How to trade NASDAQ:VRTX?
To potentially initiate a trade, it is common practice to wait for the stock to break out of the consolidation zone. This breakout signifies a potential upward movement, and traders may enter the stock at that point. Conversely, if the stock falls back below the consolidation zone, it may be sold at a loss.
Of course, there are many ways to trade or not trade NASDAQ:VRTX and this article should in no way be interpreted as trading advice. The article is purely based on an automated technical analysis and just points out the technical observations. Always make your own analysis and trade at your own responsibility.
Every day, new breakout setups can be found on ChartMill in our Breakout screener.
Disclaimer
This article should in no way be interpreted as advice. The article is based on the observed metrics at the time of writing, but you should always make your own analysis and trade or invest at your own responsibility.
483.31
+3.52 (+0.73%)
Find more stocks in the Stock Screener
VRTX Latest News and Analysis
 5 minutes ago - ChartmillGood technical signals and a possible breakout for VERTEX PHARMACEUTICALS INC (NASDAQ:VRTX).
VERTEX PHARMACEUTICALS INC (NASDAQ:VRTX) has a strong technical rating of 9 out of 10, indicating a potential breakout.
