Balancing Dividends and Fundamentals: The Case of TRAVEL + LEISURE CO (NYSE:TNL).
By Mill Chart
Last update: Apr 26, 2025
Our stock screener has singled out TRAVEL + LEISURE CO (NYSE:TNL) as a promising choice for dividend investors. TNL not only scores well in profitability, solvency, and liquidity but also offers a decent dividend. We'll explore this further.
Dividend Analysis for TNL
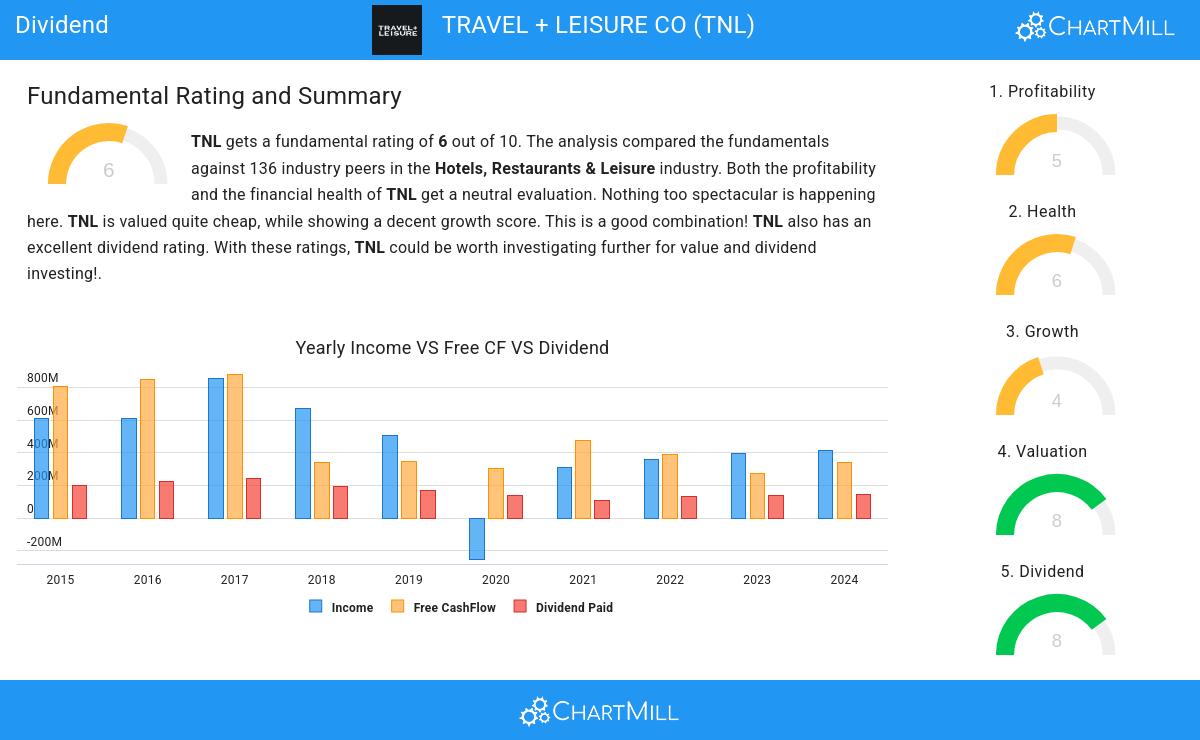
ChartMill assigns a Dividend Rating to every stock. This score ranges from 0 to 10 and evaluates the different dividend aspects, including the yield, the growth and sustainability. TNL scores a 8 out of 10:
- With a Yearly Dividend Yield of 5.20%, TNL is a good candidate for dividend investing.
- TNL's Dividend Yield is rather good when compared to the industry average which is at 3.92. TNL pays more dividend than 91.91% of the companies in the same industry.
- TNL's Dividend Yield is rather good when compared to the S&P500 average which is at 2.51.
- TNL has been paying a dividend for at least 10 years, so it has a reliable track record.
- 34.55% of the earnings are spent on dividend by TNL. This is a low number and sustainable payout ratio.
- TNL's earnings are growing more than its dividend. This makes the dividend growth sustainable.
Health Assessment of TNL
A critical element of ChartMill's stock evaluation is the Health Rating, which spans from 0 to 10. This rating considers multiple health factors, including liquidity and solvency, both in absolute terms and relative to industry peers. TNL has received a 6 out of 10:
- TNL's Altman-Z score of 2.25 is fine compared to the rest of the industry. TNL outperforms 65.44% of its industry peers.
- TNL has a Current Ratio of 3.72. This indicates that TNL is financially healthy and has no problem in meeting its short term obligations.
- TNL's Current ratio of 3.72 is amongst the best of the industry. TNL outperforms 96.32% of its industry peers.
- TNL has a Quick Ratio of 2.71. This indicates that TNL is financially healthy and has no problem in meeting its short term obligations.
- Looking at the Quick ratio, with a value of 2.71, TNL belongs to the top of the industry, outperforming 93.38% of the companies in the same industry.
Profitability Assessment of TNL
ChartMill utilizes a Profitability Rating to assess stocks, scoring them on a scale of 0 to 10. This rating takes into account a variety of profitability ratios and margins, both in absolute terms and in comparison to industry peers. TNL has earned a 5 out of 10:
- TNL's Return On Assets of 6.10% is fine compared to the rest of the industry. TNL outperforms 73.53% of its industry peers.
- The Return On Invested Capital of TNL (10.54%) is better than 75.74% of its industry peers.
- The 3 year average ROIC (10.16%) for TNL is below the current ROIC(10.54%), indicating increased profibility in the last year.
- The Profit Margin of TNL (10.63%) is better than 75.74% of its industry peers.
- The Operating Margin of TNL (19.48%) is better than 77.21% of its industry peers.
Our Best Dividend screener lists more Best Dividend stocks and is updated daily.
Our latest full fundamental report of TNL contains the most current fundamental analsysis.
Disclaimer
This is not investing advice! The article highlights some of the observations at the time of writing, but you should always make your own analysis and invest based on your own insights.
44.02
+0.28 (+0.64%)
Find more stocks in the Stock Screener
TNL Latest News and Analysis
 2 minutes ago - ChartmillBalancing Dividends and Fundamentals: The Case of TRAVEL + LEISURE CO (NYSE:TNL).
Uncovering Dividend Opportunities with TRAVEL + LEISURE CO (NYSE:TNL).
