
For those who appreciate value investing, NYSE:TNL is a compelling option with its solid fundamentals.
By Mill Chart
Last update: Sep 30, 2024
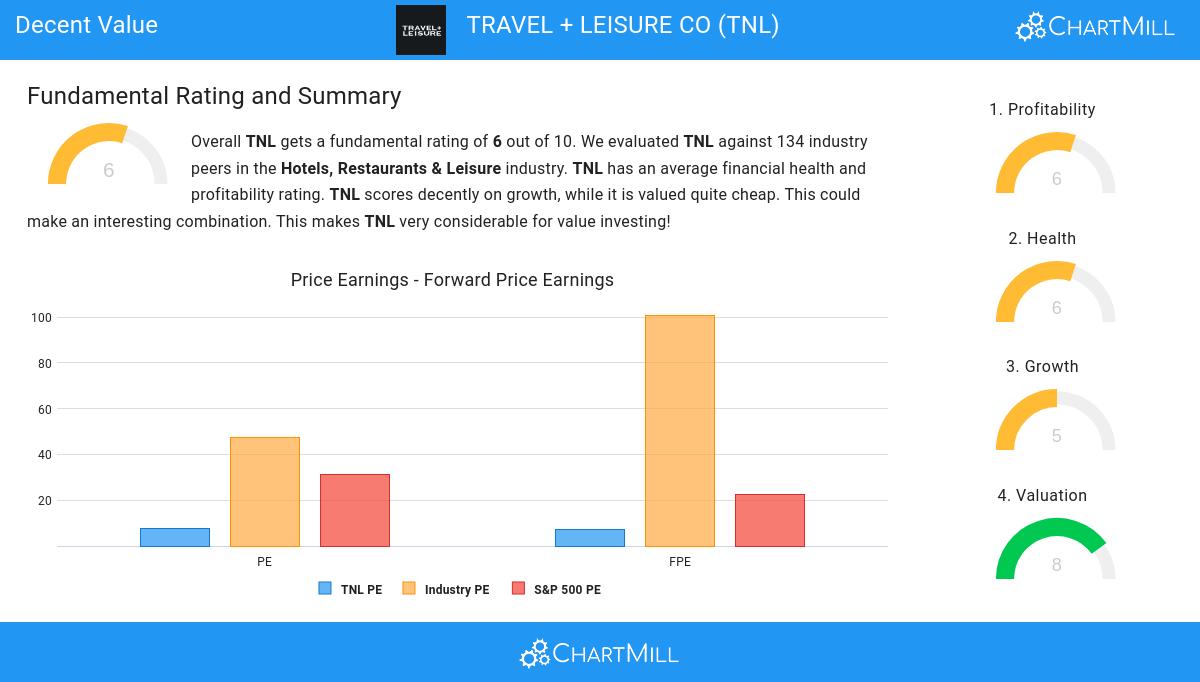
Our stock screener has spotted TRAVEL + LEISURE CO (NYSE:TNL) as an undervalued stock with solid fundamentals. NYSE:TNL shows decent health and profitability. At the same time it remains remains attractively priced. We'll dive into each aspect below.
Deciphering NYSE:TNL's Valuation Rating
ChartMill assigns a Valuation Rating to every stock. This score ranges from 0 to 10 and evaluates the different valuation aspects and compares the price to earnings and cash flows, while taking into account profitability and growth. NYSE:TNL scores a 8 out of 10:
- Based on the Price/Earnings ratio of 7.75, the valuation of TNL can be described as very cheap.
- Compared to the rest of the industry, the Price/Earnings ratio of TNL indicates a rather cheap valuation: TNL is cheaper than 96.27% of the companies listed in the same industry.
- The average S&P500 Price/Earnings ratio is at 31.19. TNL is valued rather cheaply when compared to this.
- The Price/Forward Earnings ratio is 7.26, which indicates a rather cheap valuation of TNL.
- Based on the Price/Forward Earnings ratio, TNL is valued cheaply inside the industry as 96.27% of the companies are valued more expensively.
- TNL is valuated cheaply when we compare the Price/Forward Earnings ratio to 22.50, which is the current average of the S&P500 Index.
- 64.18% of the companies in the same industry are more expensive than TNL, based on the Enterprise Value to EBITDA ratio.
- TNL's Price/Free Cash Flow ratio is rather cheap when compared to the industry. TNL is cheaper than 91.79% of the companies in the same industry.
- TNL has a very decent profitability rating, which may justify a higher PE ratio.
Assessing Profitability for NYSE:TNL
ChartMill assigns a proprietary Profitability Rating to each stock. The score is computed by evaluating various profitability ratios and margins and ranges from 0 to 10. NYSE:TNL was assigned a score of 6 for profitability:
- The Return On Assets of TNL (6.48%) is better than 76.87% of its industry peers.
- The Return On Invested Capital of TNL (10.57%) is better than 73.13% of its industry peers.
- The last Return On Invested Capital (10.57%) for TNL is above the 3 year average (9.59%), which is a sign of increasing profitability.
- TNL's Profit Margin of 11.35% is fine compared to the rest of the industry. TNL outperforms 76.87% of its industry peers.
- With a decent Operating Margin value of 19.72%, TNL is doing good in the industry, outperforming 78.36% of the companies in the same industry.
Analyzing Health Metrics
ChartMill employs a unique Health Rating system for all stocks. This rating, ranging from 0 to 10, is determined by analyzing various liquidity and solvency ratios. For NYSE:TNL, the assigned 6 for health provides valuable insights:
- TNL's Altman-Z score of 2.25 is fine compared to the rest of the industry. TNL outperforms 64.18% of its industry peers.
- A Current Ratio of 3.75 indicates that TNL has no problem at all paying its short term obligations.
- The Current ratio of TNL (3.75) is better than 97.76% of its industry peers.
- A Quick Ratio of 2.75 indicates that TNL has no problem at all paying its short term obligations.
- Looking at the Quick ratio, with a value of 2.75, TNL belongs to the top of the industry, outperforming 94.78% of the companies in the same industry.
Assessing Growth for NYSE:TNL
A key component of ChartMill's stock assessment is the Growth Rating, which spans from 0 to 10. This rating evaluates diverse growth factors, such as EPS and revenue growth, considering both past performance and future projections. NYSE:TNL has received a 5 out of 10:
- TNL shows a strong growth in Earnings Per Share. In the last year, the EPS has been growing by 25.21%, which is quite impressive.
- The Earnings Per Share is expected to grow by 9.22% on average over the next years. This is quite good.
- The EPS growth rate is accelerating: in the next years the growth will be better than in the last years.
- When comparing the Revenue growth rate of the last years to the growth rate of the upcoming years, we see that the growth is accelerating.
Every day, new Decent Value stocks can be found on ChartMill in our Decent Value screener.
Our latest full fundamental report of TNL contains the most current fundamental analsysis.
Disclaimer
Important Note: The content of this article is not intended as trading advice. It is essential to perform your own analysis and exercise caution when making trading decisions. The article presents observations created by automated analysis but does not guarantee any trading or investment outcomes. Always trade responsibly and make independent judgments.
44.02
+0.28 (+0.64%)
Find more stocks in the Stock Screener
TNL Latest News and Analysis
 a day ago - ChartmillBalancing Dividends and Fundamentals: The Case of TRAVEL + LEISURE CO (NYSE:TNL).
Uncovering Dividend Opportunities with TRAVEL + LEISURE CO (NYSE:TNL).
