Is TELKOM INDONESIA PERSERO-ADR (NYSE:TLK) suited for dividend investing?
By Mill Chart
Last update: Apr 26, 2025
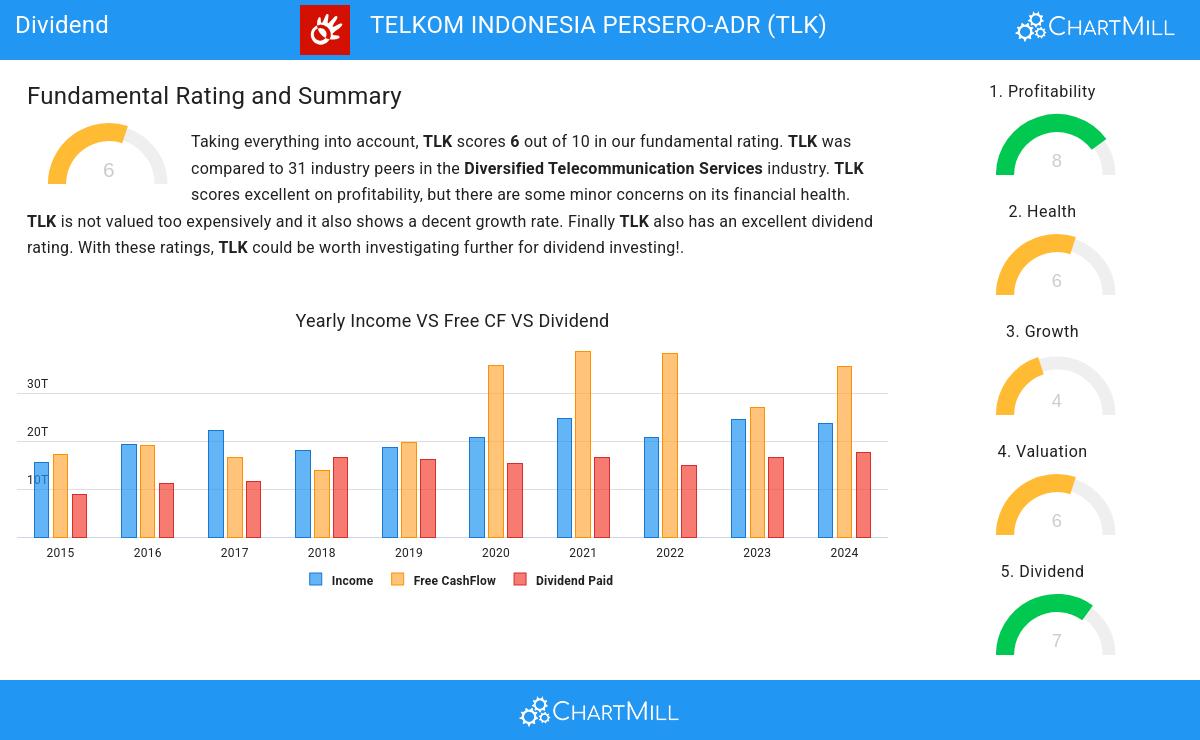
TELKOM INDONESIA PERSERO-ADR (NYSE:TLK) was identified as a stock worth exploring by dividend investors by our stock screener. TLK scores well on profitability, solvency and liquidity. At the same time it seems to pay a decent dividend. We'll explore this a bit deeper below.
Dividend Examination for TLK
ChartMill employs its own Dividend Rating system for all stocks. This score, on a scale of 0 to 10, is determined by evaluating different dividend factors, such as yield, historical performance, dividend growth, and sustainability. TLK has been assigned a 7 for dividend:
- With a Yearly Dividend Yield of 6.79%, TLK is a good candidate for dividend investing.
- TLK's Dividend Yield is rather good when compared to the industry average which is at 5.13. TLK pays more dividend than 87.10% of the companies in the same industry.
- TLK's Dividend Yield is rather good when compared to the S&P500 average which is at 2.51.
- TLK has been paying a dividend for at least 10 years, so it has a reliable track record.
- TLK's earnings are growing more than its dividend. This makes the dividend growth sustainable.
Health Analysis for TLK
ChartMill employs a unique Health Rating system for all stocks. This rating, ranging from 0 to 10, is determined by analyzing various liquidity and solvency ratios. For TLK, the assigned 6 for health provides valuable insights:
- TLK has a Altman-Z score of 2.51. This is amongst the best in the industry. TLK outperforms 93.55% of its industry peers.
- The Debt to FCF ratio of TLK is 2.16, which is a good value as it means it would take TLK, 2.16 years of fcf income to pay off all of its debts.
- TLK has a Debt to FCF ratio of 2.16. This is amongst the best in the industry. TLK outperforms 90.32% of its industry peers.
- A Debt/Equity ratio of 0.39 indicates that TLK is not too dependend on debt financing.
- TLK has a better Debt to Equity ratio (0.39) than 77.42% of its industry peers.
- The current and quick ratio evaluation for TLK is rather negative, while it does have excellent solvency and profitability. These ratios do not necessarly indicate liquidity issues and need to be evaluated against the specifics of the business.
What does the Profitability looks like for TLK
ChartMill assigns a Profitability Rating to every stock. This score ranges from 0 to 10 and evaluates the different profitability ratios and margins, both absolutely, but also relative to the industry peers. TLK scores a 8 out of 10:
- Looking at the Return On Assets, with a value of 7.89%, TLK belongs to the top of the industry, outperforming 90.32% of the companies in the same industry.
- TLK has a better Return On Equity (16.64%) than 83.87% of its industry peers.
- TLK's Return On Invested Capital of 14.33% is amongst the best of the industry. TLK outperforms 96.77% of its industry peers.
- The Average Return On Invested Capital over the past 3 years for TLK is significantly above the industry average of 5.73%.
- The Profit Margin of TLK (15.77%) is better than 90.32% of its industry peers.
- In the last couple of years the Profit Margin of TLK has grown nicely.
- TLK has a better Operating Margin (28.45%) than 93.55% of its industry peers.
- Looking at the Gross Margin, with a value of 67.94%, TLK belongs to the top of the industry, outperforming 80.65% of the companies in the same industry.
Our Best Dividend screener lists more Best Dividend stocks and is updated daily.
For an up to date full fundamental analysis you can check the fundamental report of TLK
Keep in mind
This article should in no way be interpreted as advice. The article is based on the observed metrics at the time of writing, but you should always make your own analysis and trade or invest at your own responsibility.
15.36
-0.52 (-3.27%)
Find more stocks in the Stock Screener
TLK Latest News and Analysis
 3 minutes ago - ChartmillIs TELKOM INDONESIA PERSERO-ADR (NYSE:TLK) suited for dividend investing?
Why TELKOM INDONESIA PERSERO-ADR (NYSE:TLK) qualifies as a good dividend investing stock.
