
For those who appreciate value investing, NYSE:TDW is a compelling option with its solid fundamentals.
By Mill Chart
Last update: Jan 27, 2025
Our stock screening tool has pinpointed TIDEWATER INC (NYSE:TDW) as an undervalued stock. NYSE:TDW maintains a solid financial footing. Furthermore, it remains attractively priced. Let's delve into the specifics below.
Understanding NYSE:TDW's Valuation Score
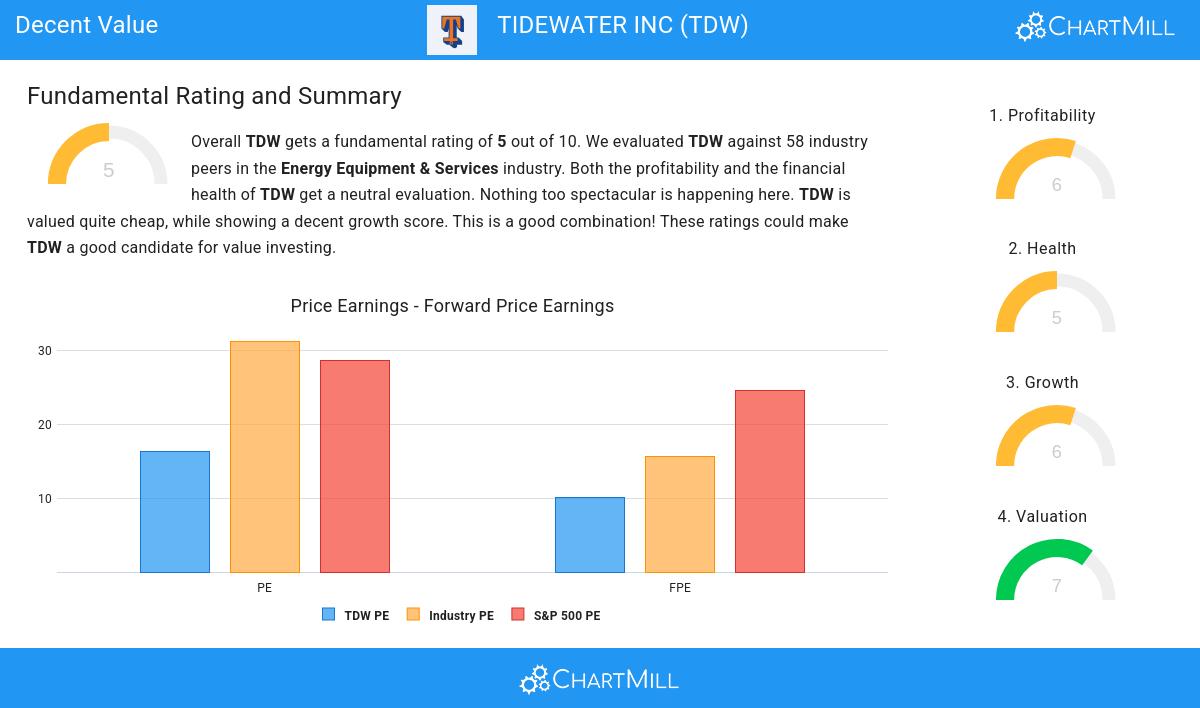
ChartMill assigns a Valuation Rating to each stock, ranging from 0 to 10. This rating is calculated by analyzing different valuation elements, such as price to earnings and free cash flow, both in absolute terms and relative to the market and industry. In the case of NYSE:TDW, the assigned 7 reflects its valuation:
- TDW's Price/Earnings ratio is a bit cheaper when compared to the industry. TDW is cheaper than 67.24% of the companies in the same industry.
- TDW is valuated rather cheaply when we compare the Price/Earnings ratio to 28.58, which is the current average of the S&P500 Index.
- Based on the Price/Forward Earnings ratio of 10.09, the valuation of TDW can be described as reasonable.
- Based on the Price/Forward Earnings ratio, TDW is valued cheaply inside the industry as 82.76% of the companies are valued more expensively.
- Compared to an average S&P500 Price/Forward Earnings ratio of 24.47, TDW is valued rather cheaply.
- 62.07% of the companies in the same industry are more expensive than TDW, based on the Price/Free Cash Flow ratio.
- The low PEG Ratio(NY), which compensates the Price/Earnings for growth, indicates a rather cheap valuation of the company.
- TDW has a very decent profitability rating, which may justify a higher PE ratio.
- A more expensive valuation may be justified as TDW's earnings are expected to grow with 73.31% in the coming years.
What does the Profitability looks like for NYSE:TDW
ChartMill employs its own Profitability Rating system for stock evaluation. This score, ranging from 0 to 10, is derived from an analysis of diverse profitability metrics and margins. In the case of NYSE:TDW, the assigned 6 is noteworthy for profitability:
- With a decent Return On Assets value of 8.86%, TDW is doing good in the industry, outperforming 74.14% of the companies in the same industry.
- TDW has a Return On Equity of 16.25%. This is in the better half of the industry: TDW outperforms 72.41% of its industry peers.
- TDW's Return On Invested Capital of 10.70% is fine compared to the rest of the industry. TDW outperforms 77.59% of its industry peers.
- The Profit Margin of TDW (13.92%) is better than 84.48% of its industry peers.
- With an excellent Operating Margin value of 21.16%, TDW belongs to the best of the industry, outperforming 84.48% of the companies in the same industry.
- Looking at the Gross Margin, with a value of 47.41%, TDW belongs to the top of the industry, outperforming 89.66% of the companies in the same industry.
- In the last couple of years the Gross Margin of TDW has grown nicely.
How We Gauge Health for NYSE:TDW
ChartMill assigns a proprietary Health Rating to each stock. The score is computed by evaluating various liquidity and solvency ratios and ranges from 0 to 10. NYSE:TDW was assigned a score of 5 for health:
- TDW has a better Altman-Z score (2.78) than 72.41% of its industry peers.
- The Debt to FCF ratio of TDW is 3.28, which is a good value as it means it would take TDW, 3.28 years of fcf income to pay off all of its debts.
- TDW has a Debt to FCF ratio of 3.28. This is in the better half of the industry: TDW outperforms 60.34% of its industry peers.
- A Current Ratio of 2.29 indicates that TDW has no problem at all paying its short term obligations.
- With a decent Current ratio value of 2.29, TDW is doing good in the industry, outperforming 65.52% of the companies in the same industry.
- A Quick Ratio of 2.19 indicates that TDW has no problem at all paying its short term obligations.
- Looking at the Quick ratio, with a value of 2.19, TDW is in the better half of the industry, outperforming 79.31% of the companies in the same industry.
Growth Insights: NYSE:TDW
Every stock receives a Growth Rating from ChartMill, ranging from 0 to 10. This rating assesses various growth aspects, including historical and projected EPS and revenue growth. NYSE:TDW boasts a 6 out of 10:
- TDW shows a strong growth in Earnings Per Share. In the last year, the EPS has been growing by 151.85%, which is quite impressive.
- Looking at the last year, TDW shows a very strong growth in Revenue. The Revenue has grown by 45.78%.
- Measured over the past years, TDW shows a quite strong growth in Revenue. The Revenue has been growing by 19.96% on average per year.
- Based on estimates for the next years, TDW will show a very strong growth in Earnings Per Share. The EPS will grow by 73.31% on average per year.
- The Revenue is expected to grow by 18.52% on average over the next years. This is quite good.
Our Decent Value screener lists more Decent Value stocks and is updated daily.
Our latest full fundamental report of TDW contains the most current fundamental analsysis.
Keep in mind
This article should in no way be interpreted as advice. The article is based on the observed metrics at the time of writing, but you should always make your own analysis and trade or invest at your own responsibility.
34.27
+2 (+6.2%)
Find more stocks in the Stock Screener
TDW Latest News and Analysis
 17 days ago - ChartmillIn the world of growth stocks, TIDEWATER INC (NYSE:TDW) shines as a value proposition.
NYSE:TDW is scoring great on several growth aspects while it also shows decent health and profitability. At the same time it remains remains attractively priced.
