
In the world of growth stocks, TIDEWATER INC (NYSE:TDW) shines as a value proposition.
By Mill Chart
Last update: Apr 1, 2025
Our stock screening tool has pinpointed TIDEWATER INC (NYSE:TDW) as a growth stock that isn't overvalued. TDW is excelling in various growth indicators while maintaining a solid financial footing. Furthermore, it remains attractively priced. Let's delve into the specifics below.
ChartMill's Evaluation of Growth
ChartMill assigns a Growth Rating to each stock, ranging from 0 to 10. This rating is determined by analyzing different growth elements, including EPS and revenue growth, spanning both historical and future figures. In the case of TDW, the assigned 7 reflects its growth potential:
- TDW shows a strong growth in Earnings Per Share. In the last year, the EPS has been growing by 83.78%, which is quite impressive.
- Looking at the last year, TDW shows a very strong growth in Revenue. The Revenue has grown by 33.25%.
- TDW shows a strong growth in Revenue. Measured over the last years, the Revenue has been growing by 22.57% yearly.
- The Earnings Per Share is expected to grow by 29.32% on average over the next years. This is a very strong growth
- Based on estimates for the next years, TDW will show a quite strong growth in Revenue. The Revenue will grow by 9.11% on average per year.
Valuation Assessment of TDW
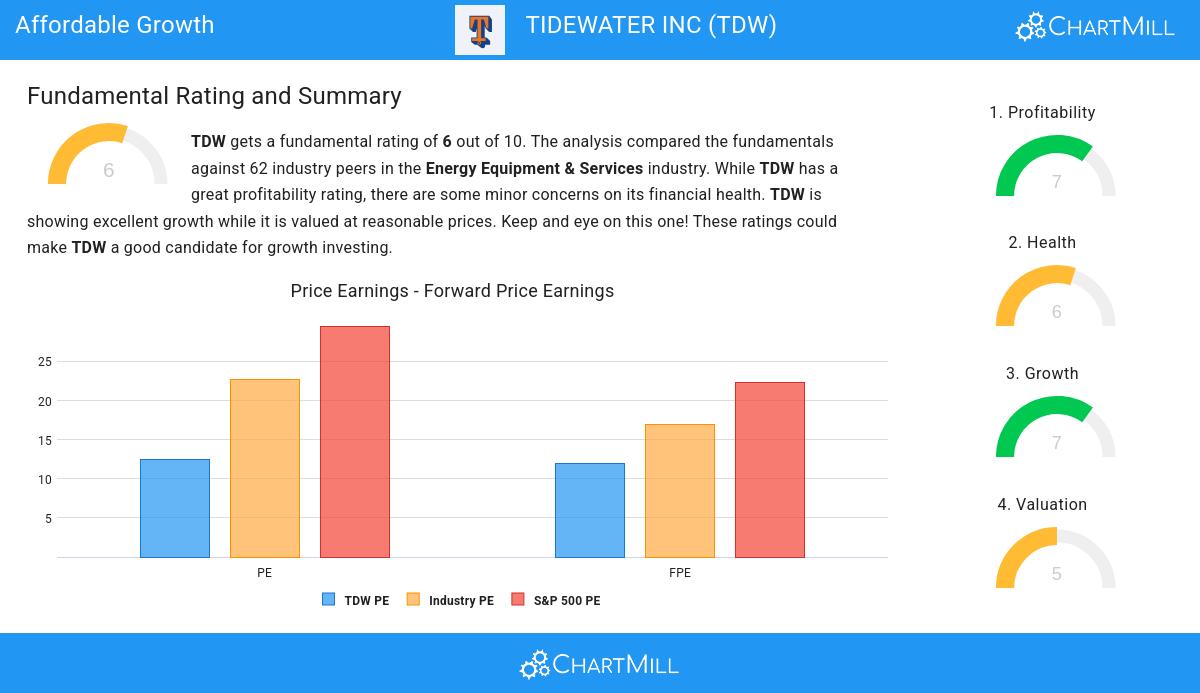
ChartMill assigns a proprietary Valuation Rating to each stock. The score is computed by evaluating various valuation aspects, like price to earnings and free cash flow, both absolutely as relative to the market and industry. TDW was assigned a score of 5 for valuation:
- 69.35% of the companies in the same industry are more expensive than TDW, based on the Price/Earnings ratio.
- TDW's Price/Earnings ratio indicates a rather cheap valuation when compared to the S&P500 average which is at 29.51.
- 74.19% of the companies in the same industry are more expensive than TDW, based on the Price/Forward Earnings ratio.
- Compared to an average S&P500 Price/Forward Earnings ratio of 22.30, TDW is valued a bit cheaper.
- 75.81% of the companies in the same industry are more expensive than TDW, based on the Price/Free Cash Flow ratio.
- The decent profitability rating of TDW may justify a higher PE ratio.
- A more expensive valuation may be justified as TDW's earnings are expected to grow with 29.32% in the coming years.
Analyzing Health Metrics
Every stock is evaluated by ChartMill, receiving a Health Rating on a scale of 0 to 10. This assessment considers different health aspects, including liquidity and solvency, both in absolute terms and relative to industry peers. TDW has achieved a 6 out of 10:
- TDW has a better Altman-Z score (2.32) than 67.74% of its industry peers.
- TDW has a debt to FCF ratio of 2.59. This is a good value and a sign of high solvency as TDW would need 2.59 years to pay back of all of its debts.
- With a decent Debt to FCF ratio value of 2.59, TDW is doing good in the industry, outperforming 64.52% of the companies in the same industry.
- A Current Ratio of 2.11 indicates that TDW has no problem at all paying its short term obligations.
- TDW has a Quick Ratio of 2.00. This indicates that TDW is financially healthy and has no problem in meeting its short term obligations.
- With a decent Quick ratio value of 2.00, TDW is doing good in the industry, outperforming 74.19% of the companies in the same industry.
Exploring TDW's Profitability
ChartMill utilizes a Profitability Rating to assess stocks, scoring them on a scale of 0 to 10. This rating takes into account a variety of profitability ratios and margins, both in absolute terms and in comparison to industry peers. TDW has earned a 7 out of 10:
- TDW has a Return On Assets of 8.71%. This is in the better half of the industry: TDW outperforms 75.81% of its industry peers.
- TDW has a better Return On Equity (16.22%) than 75.81% of its industry peers.
- The Return On Invested Capital of TDW (12.46%) is better than 85.48% of its industry peers.
- The 3 year average ROIC (7.28%) for TDW is below the current ROIC(12.46%), indicating increased profibility in the last year.
- Looking at the Profit Margin, with a value of 13.42%, TDW belongs to the top of the industry, outperforming 82.26% of the companies in the same industry.
- TDW's Operating Margin of 21.96% is amongst the best of the industry. TDW outperforms 83.87% of its industry peers.
- Looking at the Gross Margin, with a value of 48.24%, TDW belongs to the top of the industry, outperforming 88.71% of the companies in the same industry.
- In the last couple of years the Gross Margin of TDW has grown nicely.
Every day, new Affordable Growth stocks can be found on ChartMill in our Affordable Growth screener.
Check the latest full fundamental report of TDW for a complete fundamental analysis.
Disclaimer
Important Note: The content of this article is not intended as trading advice. It is essential to perform your own analysis and exercise caution when making trading decisions. The article presents observations created by automated analysis but does not guarantee any trading or investment outcomes. Always trade responsibly and make independent judgments.
NYSE:TDW (4/24/2025, 2:46:54 PM)
35.77
+1.69 (+4.96%)
Find more stocks in the Stock Screener
