STATE STREET CORP (NYSE:STT) showing some interesting technicals. Here's why.
By Mill Chart
Last update: Feb 21, 2025
Our stock screener has flagged STATE STREET CORP (NYSE:STT) as a potential breakout candidate. This occurs when the stock shows signs of consolidation after a notable upward trend. While we can't predict the actual breakout, it's worth monitoring NYSE:STT for potential movement.
In-Depth Technical Analysis of NYSE:STT
Every day, ChartMill assigns a Technical Rating to each stock, providing a score ranging from 0 to 10. This rating is determined by evaluating various technical indicators and properties.
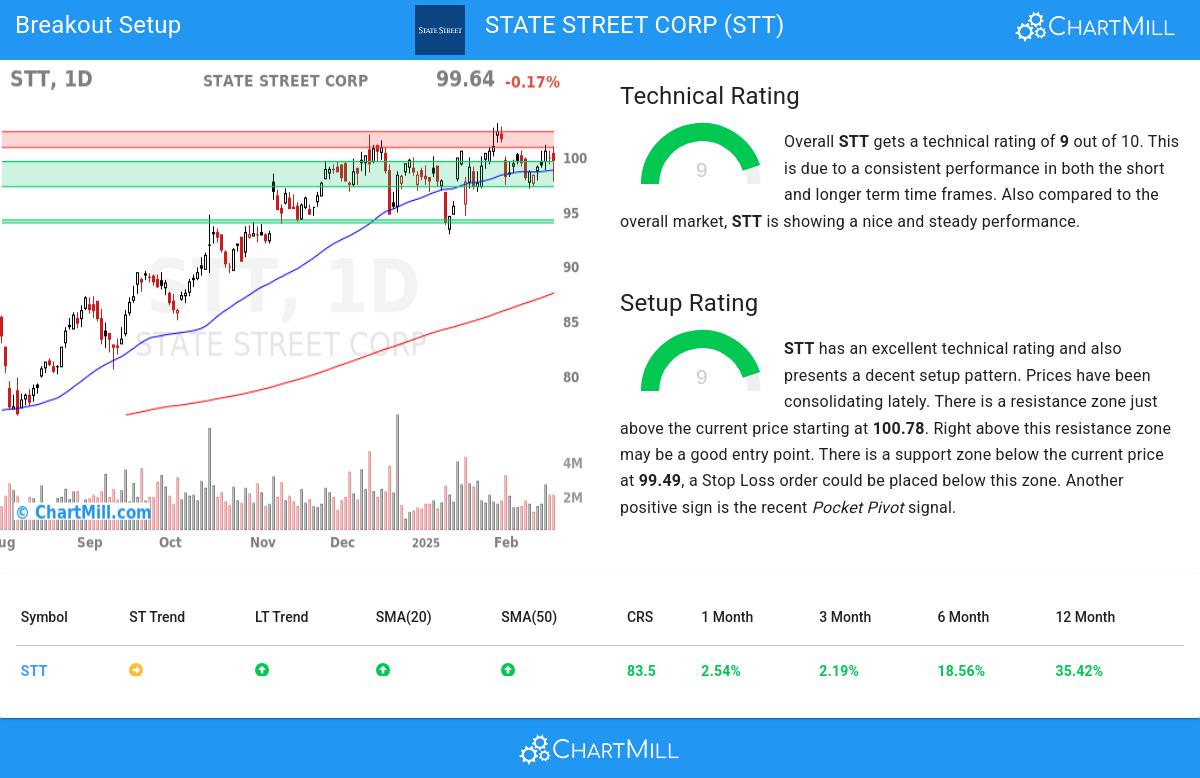
Overall STT gets a technical rating of 9 out of 10. Both in the recent history as in the last year, STT has proven to be a steady performer, scoring decent points in every aspect analyzed.
- The short term is neutral, but the long term trend is still positive. Not much to worry about for now.
- Looking at the yearly performance, STT did better than 83% of all other stocks. We also observe that the gains produced by STT over the past year are nicely spread over this period.
- STT is part of the Capital Markets industry. There are 225 other stocks in this industry. STT outperforms 83% of them.
- STT is currently trading in the upper part of its 52 week range. The S&P500 Index however is currently trading near a new high, so STT is lagging the market slightly.
- In the last month STT has a been trading in the 96.77 - 103.00 range, which is quite wide. It is currently trading in the middle of this range where prices have been consolidating recently, this may present a good entry opportunity, but some resistance may be present above.
For an up to date full technical analysis you can check the technical report of STT
How does the Setup look for NYSE:STT
Besides the Technical Rating, ChartMill also assign a Setup Rating to every stock. This setup score also ranges from 0 to 10 and determines to which extend the stock is consolidating. This is achieved by evaluating multiple short term technical indicators. NYSE:STT currently has a 9 as setup rating:
Besides having an excellent technical rating, STT also presents a decent setup pattern. Prices have been consolidating lately. There is a resistance zone just above the current price starting at 100.78. Right above this resistance zone may be a good entry point. There is a support zone below the current price at 99.49, a Stop Loss order could be placed below this zone. Very recently a Pocket Pivot signal was observed. This is another positive sign.
Trading breakout setups.
For a potential trade one would typically wait until the stock breaks out of the consolidation zone to enter the stock and it could be sold again for a loss when it would fall back below the zone.
Of course, there are many ways to trade or not trade NYSE:STT and this article should in no way be interpreted as trading advice. The article is purely based on an automated technical analysis and just points out the technical observations. Always make your own analysis and trade at your own responsibility.
More breakout setups can be found in our Breakout screener.
Keep in mind
Important Note: The content of this article is not intended as trading advice. It is essential to perform your own analysis and exercise caution when making trading decisions. The article presents observations created by automated analysis but does not guarantee any trading or investment outcomes. Always trade responsibly and make independent judgments.
99.64
-0.17 (-0.17%)
Find more stocks in the Stock Screener
STT Latest News and Analysis
 5 minutes ago - ChartmillSTATE STREET CORP (NYSE:STT) showing some interesting technicals. Here's why.
Interesting Technical Analysis finding for STATE STREET CORP (NYSE:STT): Indications Suggest NYSE:STT Could Be on the Verge of a Breakout.
