A technical analysis of SOUTHERN CO/THE (NYSE:SO).
By Mill Chart
Last update: Apr 24, 2025
Our stock screener has detected a potential breakout setup on SOUTHERN CO/THE (NYSE:SO). This breakout pattern is observed when a stock consolidates following a strong upward movement. It's important to note that this pattern is based on technical analysis, and the actual breakout outcome is uncertain. However, it might be worth keeping an eye on NYSE:SO.
In-Depth Technical Analysis of SO
ChartMill employs a sophisticated system to assign a Technical Rating to every stock in its analysis. This rating, which ranges from 0 to 10, is determined by carefully assessing multiple technical indicators and properties.
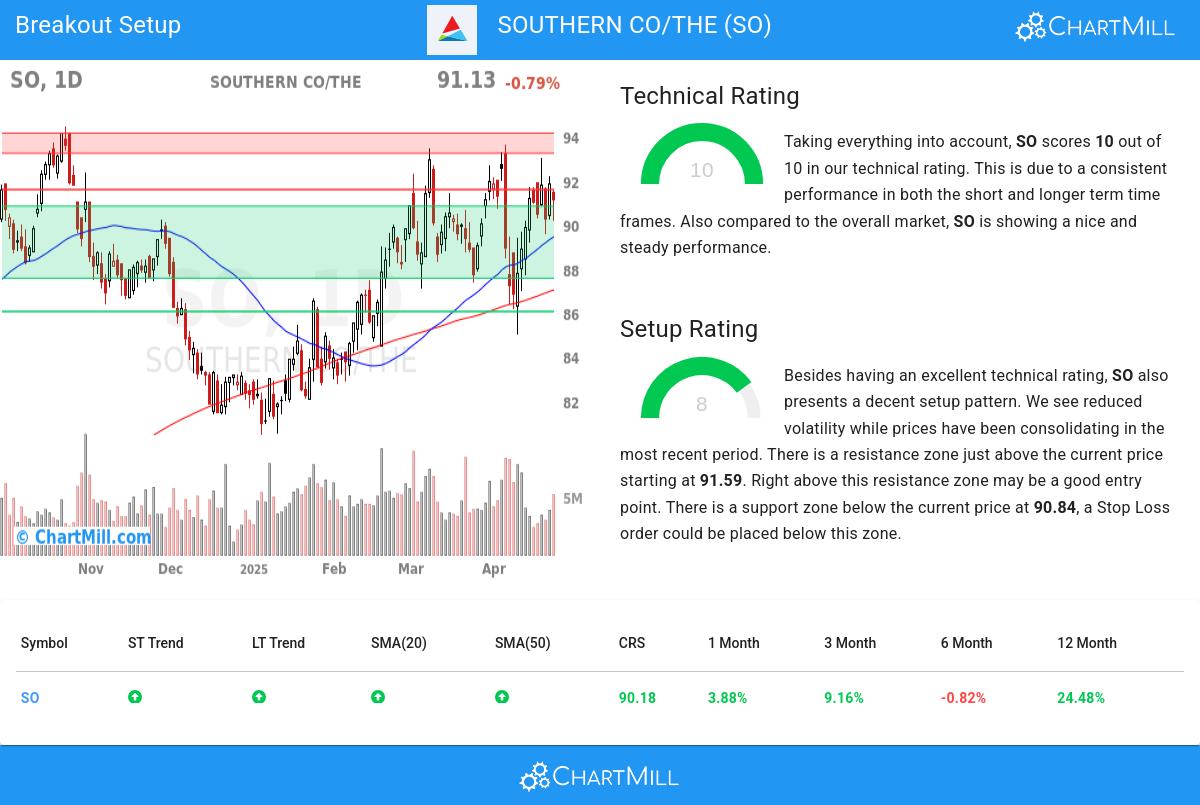
We assign a technical rating of 10 out of 10 to SO. Both in the recent history as in the last year, SO has proven to be a steady performer, scoring decent points in every aspect analyzed.
- Both the short term and long term trends are positive. This is a very positive sign.
- Looking at the yearly performance, SO did better than 90% of all other stocks.
- SO is currently trading in the upper part of its 52 week range. The market is still in the middle of its 52 week range, so SO slightly outperforms the market at the moment.
- In the last month SO has a been trading in the 85.00 - 93.65 range, which is quite wide. It is currently trading in the middle of this range where prices have been consolidating recently, this may present a good entry opportunity, but some resistance may be present above.
- SO is part of the Electric Utilities industry. There are 46 other stocks in this industry, SO did better than 64% of them.
Our latest full technical report of SO contains the most current technical analsysis.
Why is SO a setup?
ChartMill also assign a Setup Rating to every stock. With this score it is determined to what extend the stock has been trading in a range in the recent days and weeks. This score also ranges from 0 to 10 and is updated daily. The setup score evaluates various short term technical indicators. SO scores a 8 out of 10:
Besides having an excellent technical rating, SO also presents a decent setup pattern. We see reduced volatility while prices have been consolidating in the most recent period. There is a resistance zone just above the current price starting at 91.59. Right above this resistance zone may be a good entry point. There is a support zone below the current price at 90.84, a Stop Loss order could be placed below this zone.
How can SO be traded?
A breakout could materialize when the stock breaks out to new highs above the current consolidation zone. One could wait for this to happen and buy when this happens. A stop loss could be placed below the consolidation zone.
Please note that this article should not be construed as trading advice. The information provided is solely based on automated technical analysis and serves to highlight technical observations. It is important to conduct your own analysis and make trading decisions based on your own judgment and responsibility.
More breakout setups can be found in our Breakout screener.
Disclaimer
This article should in no way be interpreted as advice. The article is based on the observed metrics at the time of writing, but you should always make your own analysis and trade or invest at your own responsibility.
91.13
-0.73 (-0.79%)
Find more stocks in the Stock Screener
SO Latest News and Analysis
 2 minutes ago - ChartmillA technical analysis of SOUTHERN CO/THE (NYSE:SO).
SOUTHERN CO/THE (NYSE:SO) Reveals Intriguing Technical Aspects. Indications Suggest NYSE:SO Could Be on the Verge of a Breakout. Here's What You Need to Know.
