
Investors should take notice of PULTEGROUP INC (NYSE:PHM)—it offers a great deal for the fundamentals it presents.
By Mill Chart
Last update: Mar 4, 2025
Our stock screener has singled out PULTEGROUP INC (NYSE:PHM) as a stellar value proposition. NYSE:PHM not only scores well in profitability, solvency, and liquidity but also maintains a very reasonable price point. We'll explore this further.
How do we evaluate the Valuation for NYSE:PHM?
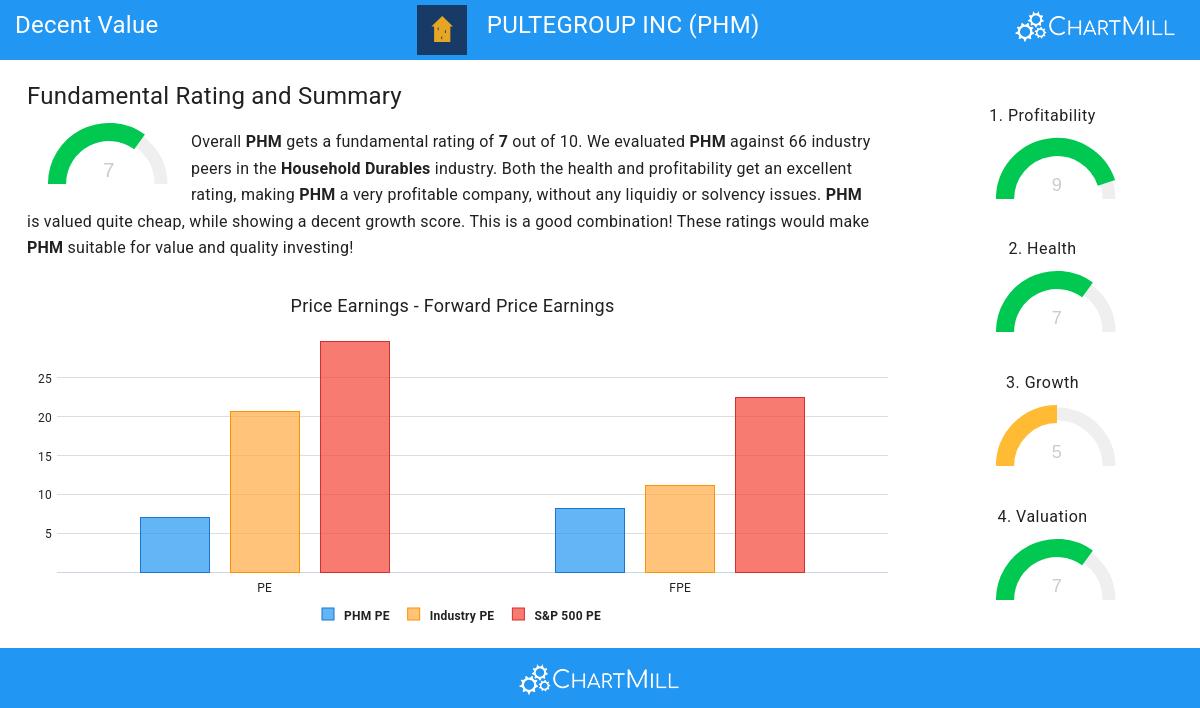
ChartMill provides a Valuation Rating to every stock, ranging from 0 to 10. This rating assesses various valuation aspects, comparing price to earnings and cash flows, while considering factors like profitability and growth. NYSE:PHM boasts a 7 out of 10:
- With a Price/Earnings ratio of 7.03, the valuation of PHM can be described as very cheap.
- Based on the Price/Earnings ratio, PHM is valued cheaply inside the industry as 81.54% of the companies are valued more expensively.
- PHM is valuated cheaply when we compare the Price/Earnings ratio to 29.75, which is the current average of the S&P500 Index.
- With a Price/Forward Earnings ratio of 8.22, the valuation of PHM can be described as very reasonable.
- 72.31% of the companies in the same industry are more expensive than PHM, based on the Price/Forward Earnings ratio.
- PHM's Price/Forward Earnings ratio indicates a rather cheap valuation when compared to the S&P500 average which is at 22.44.
- Compared to the rest of the industry, the Enterprise Value to EBITDA ratio of PHM indicates a rather cheap valuation: PHM is cheaper than 90.77% of the companies listed in the same industry.
- 75.38% of the companies in the same industry are more expensive than PHM, based on the Price/Free Cash Flow ratio.
- PHM has an outstanding profitability rating, which may justify a higher PE ratio.
What does the Profitability looks like for NYSE:PHM
ChartMill assigns a Profitability Rating to every stock. This score ranges from 0 to 10 and evaluates the different profitability ratios and margins, both absolutely, but also relative to the industry peers. NYSE:PHM scores a 9 out of 10:
- The Return On Assets of PHM (17.76%) is better than 96.92% of its industry peers.
- PHM's Return On Equity of 25.44% is amongst the best of the industry. PHM outperforms 87.69% of its industry peers.
- The Return On Invested Capital of PHM (19.28%) is better than 95.38% of its industry peers.
- PHM had an Average Return On Invested Capital over the past 3 years of 19.16%. This is significantly above the industry average of 12.03%.
- The 3 year average ROIC (19.16%) for PHM is below the current ROIC(19.28%), indicating increased profibility in the last year.
- PHM has a better Profit Margin (17.18%) than 93.85% of its industry peers.
- PHM's Profit Margin has improved in the last couple of years.
- Looking at the Operating Margin, with a value of 21.85%, PHM belongs to the top of the industry, outperforming 93.85% of the companies in the same industry.
- In the last couple of years the Operating Margin of PHM has grown nicely.
- In the last couple of years the Gross Margin of PHM has grown nicely.
How do we evaluate the Health for NYSE:PHM?
ChartMill utilizes a Health Rating to assess stocks, scoring them on a scale of 0 to 10. This rating takes into account a variety of liquidity and solvency ratios, both in absolute terms and in comparison to industry peers. NYSE:PHM has earned a 7 out of 10:
- An Altman-Z score of 5.69 indicates that PHM is not in any danger for bankruptcy at the moment.
- With an excellent Altman-Z score value of 5.69, PHM belongs to the best of the industry, outperforming 84.62% of the companies in the same industry.
- PHM has a debt to FCF ratio of 1.38. This is a very positive value and a sign of high solvency as it would only need 1.38 years to pay back of all of its debts.
- PHM has a Debt to FCF ratio of 1.38. This is in the better half of the industry: PHM outperforms 75.38% of its industry peers.
- A Debt/Equity ratio of 0.18 indicates that PHM is not too dependend on debt financing.
- The Debt to Equity ratio of PHM (0.18) is better than 70.77% of its industry peers.
- A Current Ratio of 6.07 indicates that PHM has no problem at all paying its short term obligations.
- PHM has a better Current ratio (6.07) than 81.54% of its industry peers.
Growth Analysis for NYSE:PHM
A key component of ChartMill's stock assessment is the Growth Rating, which spans from 0 to 10. This rating evaluates diverse growth factors, such as EPS and revenue growth, considering both past performance and future projections. NYSE:PHM has received a 5 out of 10:
- PHM shows a strong growth in Earnings Per Share. In the last year, the EPS has been growing by 25.74%, which is quite impressive.
- Measured over the past years, PHM shows a very strong growth in Earnings Per Share. The EPS has been growing by 32.15% on average per year.
- Looking at the last year, PHM shows a quite strong growth in Revenue. The Revenue has grown by 11.74% in the last year.
- The Revenue has been growing by 11.94% on average over the past years. This is quite good.
Our Decent Value screener lists more Decent Value stocks and is updated daily.
Our latest full fundamental report of PHM contains the most current fundamental analsysis.
Disclaimer
Important Note: The content of this article is not intended as trading advice. It is essential to perform your own analysis and exercise caution when making trading decisions. The article presents observations created by automated analysis but does not guarantee any trading or investment outcomes. Always trade responsibly and make independent judgments.
NYSE:PHM (12/16/2025, 11:02:57 AM)
124.56
-1.69 (-1.34%)
Find more stocks in the Stock Screener
