PDD HOLDINGS INC (NASDAQ:PDD) is showing good growth, while it is not too expensive.
By Mill Chart
Last update: Mar 18, 2025
Our stock screener has spotted PDD HOLDINGS INC (NASDAQ:PDD) as a growth stock which is not overvalued. PDD is scoring great on several growth aspects while it also shows decent health and profitability. At the same time it remains remains attractively priced. We'll dive into each aspect below.
Understanding PDD's Growth Score
ChartMill employs its own Growth Rating system for all stocks. This score, ranging from 0 to 10, is derived by evaluating different growth factors, such as EPS and revenue growth, taking into account both past performance and future projections. PDD has earned a 8 for growth:
- The Earnings Per Share has grown by an impressive 113.90% over the past year.
- Looking at the last year, PDD shows a very strong growth in Revenue. The Revenue has grown by 87.39%.
- Measured over the past years, PDD shows a very strong growth in Revenue. The Revenue has been growing by 79.96% on average per year.
- The Earnings Per Share is expected to grow by 23.38% on average over the next years. This is a very strong growth
- PDD is expected to show a strong growth in Revenue. In the coming years, the Revenue will grow by 24.41% yearly.
Exploring PDD's Valuation
To assess a stock's valuation, ChartMill utilizes a Valuation Rating on a scale of 0 to 10. This comprehensive assessment considers various valuation aspects, comparing price to earnings and cash flows, while factoring in profitability and growth. PDD has achieved a 8 out of 10:
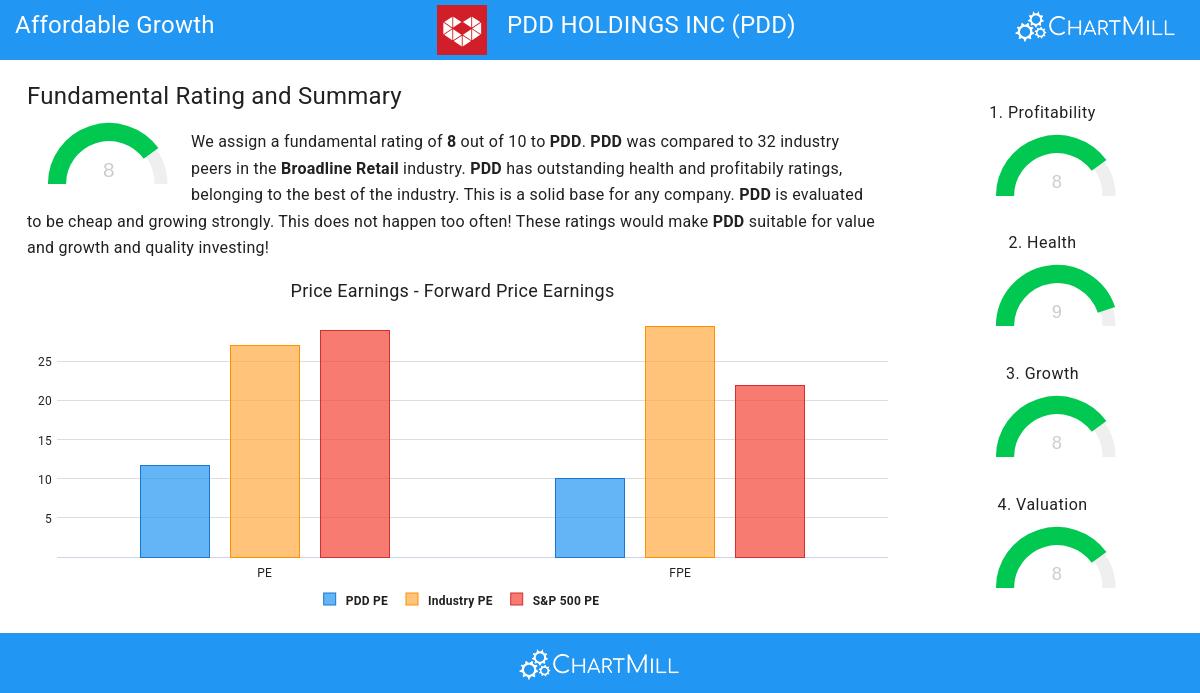
- Based on the Price/Earnings ratio of 11.68, the valuation of PDD can be described as reasonable.
- 75.00% of the companies in the same industry are more expensive than PDD, based on the Price/Earnings ratio.
- PDD is valuated cheaply when we compare the Price/Earnings ratio to 28.89, which is the current average of the S&P500 Index.
- With a Price/Forward Earnings ratio of 10.00, the valuation of PDD can be described as very reasonable.
- Based on the Price/Forward Earnings ratio, PDD is valued cheaper than 84.38% of the companies in the same industry.
- Compared to an average S&P500 Price/Forward Earnings ratio of 21.88, PDD is valued rather cheaply.
- Based on the Enterprise Value to EBITDA ratio, PDD is valued a bit cheaper than 75.00% of the companies in the same industry.
- Based on the Price/Free Cash Flow ratio, PDD is valued a bit cheaper than 71.88% of the companies in the same industry.
- The low PEG Ratio(NY), which compensates the Price/Earnings for growth, indicates a rather cheap valuation of the company.
- The excellent profitability rating of PDD may justify a higher PE ratio.
- PDD's earnings are expected to grow with 34.87% in the coming years. This may justify a more expensive valuation.
Deciphering PDD's Health Rating
ChartMill utilizes a Health Rating to assess stocks, scoring them on a scale of 0 to 10. This rating takes into account a variety of liquidity and solvency ratios, both in absolute terms and in comparison to industry peers. PDD has earned a 9 out of 10:
- PDD has an Altman-Z score of 6.68. This indicates that PDD is financially healthy and has little risk of bankruptcy at the moment.
- The Altman-Z score of PDD (6.68) is better than 87.50% of its industry peers.
- PDD has a debt to FCF ratio of 0.04. This is a very positive value and a sign of high solvency as it would only need 0.04 years to pay back of all of its debts.
- With an excellent Debt to FCF ratio value of 0.04, PDD belongs to the best of the industry, outperforming 93.75% of the companies in the same industry.
- A Debt/Equity ratio of 0.02 indicates that PDD is not too dependend on debt financing.
- With a decent Debt to Equity ratio value of 0.02, PDD is doing good in the industry, outperforming 78.13% of the companies in the same industry.
- PDD has a Current Ratio of 2.15. This indicates that PDD is financially healthy and has no problem in meeting its short term obligations.
- PDD has a better Current ratio (2.15) than 78.13% of its industry peers.
- PDD has a Quick Ratio of 2.15. This indicates that PDD is financially healthy and has no problem in meeting its short term obligations.
- With an excellent Quick ratio value of 2.15, PDD belongs to the best of the industry, outperforming 90.63% of the companies in the same industry.
Profitability Insights: PDD
ChartMill's Profitability Rating offers a unique perspective on stock analysis, providing scores from 0 to 10. These ratings consider a wide range of profitability metrics and margins, both in comparison to industry peers and on their own merits. For PDD, the assigned 8 is a significant indicator of profitability:
- PDD has a Return On Assets of 23.19%. This is amongst the best in the industry. PDD outperforms 100.00% of its industry peers.
- PDD's Return On Equity of 38.87% is amongst the best of the industry. PDD outperforms 96.88% of its industry peers.
- PDD has a Return On Invested Capital of 31.27%. This is amongst the best in the industry. PDD outperforms 100.00% of its industry peers.
- PDD had an Average Return On Invested Capital over the past 3 years of 17.97%. This is significantly above the industry average of 11.48%.
- The last Return On Invested Capital (31.27%) for PDD is above the 3 year average (17.97%), which is a sign of increasing profitability.
- The Profit Margin of PDD (29.10%) is better than 100.00% of its industry peers.
- The Operating Margin of PDD (28.28%) is better than 100.00% of its industry peers.
- The Gross Margin of PDD (62.06%) is better than 84.38% of its industry peers.
Every day, new Affordable Growth stocks can be found on ChartMill in our Affordable Growth screener.
For an up to date full fundamental analysis you can check the fundamental report of PDD
Disclaimer
This is not investing advice! The article highlights some of the observations at the time of writing, but you should always make your own analysis and invest based on your own insights.
NASDAQ:PDD (4/17/2025, 12:24:10 PM)
93.19
+0.84 (+0.91%)
Find more stocks in the Stock Screener
PDD Latest News and Analysis
 9 days ago - ChartmillFor those who appreciate growth without the sticker shock, PDD HOLDINGS INC (NASDAQ:PDD) is worth considering.
NASDAQ:PDD is scoring great on several growth aspects while it also shows decent health and profitability. At the same time it remains remains attractively priced.
 15 days ago - ChartmillPDD HOLDINGS INC (NASDAQ:PDD)—Positioned as a High-Growth Stock, Ready for a Potential Breakout.
Based on fundamental and technical analysis of NASDAQ:PDD we ask: Why PDD HOLDINGS INC (NASDAQ:PDD) Is a Standout High-Growth Stock in a Consolidation Phase.
