Investors seeking growth at a reasonable cost should explore NASDAQ:NXT.
By Mill Chart
Last update: Feb 21, 2025
Take a closer look at NEXTRACKER INC-CL A (NASDAQ:NXT), an affordable growth stock uncovered by our stock screener. NASDAQ:NXT boasts strong growth prospects and excels in financial health indicators, all while maintaining a reasonable valuation. Let's break it down further.
What does the Growth looks like for NASDAQ:NXT
ChartMill assigns a Growth Rating to every stock. This score ranges from 0 to 10 and evaluates the different growth aspects like EPS and Revenue, both in the past as in the future. NASDAQ:NXT scores a 7 out of 10:
- The Earnings Per Share has grown by an impressive 57.49% over the past year.
- NXT shows a strong growth in Revenue. In the last year, the Revenue has grown by 21.46%.
- The Revenue has been growing by 30.49% on average over the past years. This is a very strong growth!
- The Revenue is expected to grow by 10.99% on average over the next years. This is quite good.
- When comparing the EPS growth rate of the last years to the growth rate of the upcoming years, we see that the growth is accelerating.
ChartMill's Evaluation of Valuation
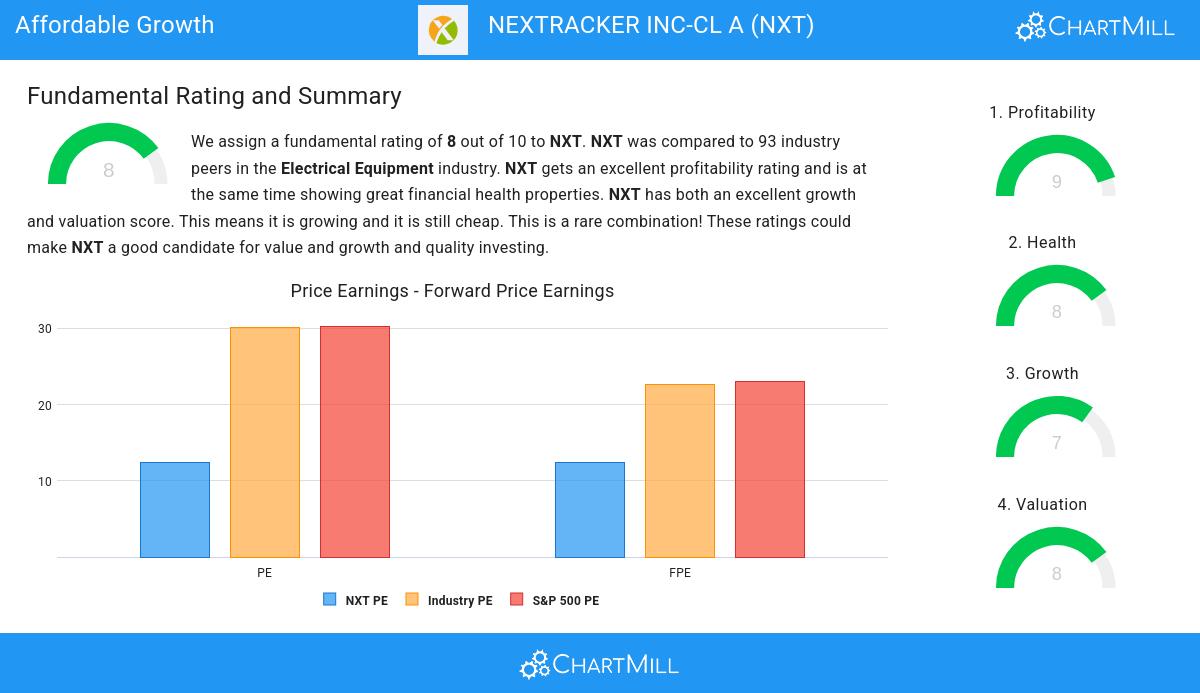
To assess a stock's valuation, ChartMill utilizes a Valuation Rating on a scale of 0 to 10. This comprehensive assessment considers various valuation aspects, comparing price to earnings and cash flows, while factoring in profitability and growth. NASDAQ:NXT has achieved a 8 out of 10:
- 89.13% of the companies in the same industry are more expensive than NXT, based on the Price/Earnings ratio.
- Compared to an average S&P500 Price/Earnings ratio of 30.30, NXT is valued rather cheaply.
- Based on the Price/Forward Earnings ratio, NXT is valued cheaper than 88.04% of the companies in the same industry.
- NXT is valuated rather cheaply when we compare the Price/Forward Earnings ratio to 23.06, which is the current average of the S&P500 Index.
- 91.30% of the companies in the same industry are more expensive than NXT, based on the Enterprise Value to EBITDA ratio.
- Based on the Price/Free Cash Flow ratio, NXT is valued cheaper than 90.22% of the companies in the same industry.
- The low PEG Ratio(NY), which compensates the Price/Earnings for growth, indicates a rather cheap valuation of the company.
- The excellent profitability rating of NXT may justify a higher PE ratio.
ChartMill's Evaluation of Health
Every stock is evaluated by ChartMill, receiving a Health Rating on a scale of 0 to 10. This assessment considers different health aspects, including liquidity and solvency, both in absolute terms and relative to industry peers. NASDAQ:NXT has achieved a 8 out of 10:
- An Altman-Z score of 3.57 indicates that NXT is not in any danger for bankruptcy at the moment.
- The Altman-Z score of NXT (3.57) is better than 73.91% of its industry peers.
- NXT has a debt to FCF ratio of 0.29. This is a very positive value and a sign of high solvency as it would only need 0.29 years to pay back of all of its debts.
- Looking at the Debt to FCF ratio, with a value of 0.29, NXT belongs to the top of the industry, outperforming 94.57% of the companies in the same industry.
- A Debt/Equity ratio of 0.10 indicates that NXT is not too dependend on debt financing.
- Looking at the Debt to Equity ratio, with a value of 0.10, NXT is in the better half of the industry, outperforming 65.22% of the companies in the same industry.
- A Current Ratio of 2.20 indicates that NXT has no problem at all paying its short term obligations.
- The Current ratio of NXT (2.20) is better than 63.04% of its industry peers.
- The Quick ratio of NXT (1.96) is better than 76.09% of its industry peers.
Exploring NASDAQ:NXT's Profitability
ChartMill assigns a proprietary Profitability Rating to each stock. The score is computed by evaluating various profitability ratios and margins and ranges from 0 to 10. NASDAQ:NXT was assigned a score of 9 for profitability:
- With an excellent Return On Assets value of 18.69%, NXT belongs to the best of the industry, outperforming 100.00% of the companies in the same industry.
- The Return On Equity of NXT (39.64%) is better than 98.91% of its industry peers.
- NXT has a Return On Invested Capital of 26.41%. This is amongst the best in the industry. NXT outperforms 97.83% of its industry peers.
- NXT had an Average Return On Invested Capital over the past 3 years of 17.04%. This is significantly above the industry average of 10.23%.
- The last Return On Invested Capital (26.41%) for NXT is above the 3 year average (17.04%), which is a sign of increasing profitability.
- NXT has a better Profit Margin (20.12%) than 98.91% of its industry peers.
- NXT's Profit Margin has improved in the last couple of years.
- The Operating Margin of NXT (25.83%) is better than 100.00% of its industry peers.
- NXT's Operating Margin has improved in the last couple of years.
- Looking at the Gross Margin, with a value of 37.66%, NXT belongs to the top of the industry, outperforming 88.04% of the companies in the same industry.
- In the last couple of years the Gross Margin of NXT has grown nicely.
More Affordable Growth stocks can be found in our Affordable Growth screener.
For an up to date full fundamental analysis you can check the fundamental report of NXT
Disclaimer
Important Note: The content of this article is not intended as trading advice. It is essential to perform your own analysis and exercise caution when making trading decisions. The article presents observations created by automated analysis but does not guarantee any trading or investment outcomes. Always trade responsibly and make independent judgments.
48.42
-0.19 (-0.39%)
Find more stocks in the Stock Screener
NXT Latest News and Analysis
 a few seconds ago - ChartmillInvestors seeking growth at a reasonable cost should explore NASDAQ:NXT.
Discover NEXTRACKER INC-CL A, an undervalued growth gem. NASDAQ:NXT is shining in terms of growth metrics, and it's also displaying strong financial health and profitability, retaining an appealing valuation.
 17 days ago - ChartmillNASDAQ:NXT is probably undervalued for the fundamentals it is displaying.
NEXTRACKER INC-CL A is a hidden gem, featuring undervaluation and robust fundamentals. NASDAQ:NXT showcases decent financial health and profitability, coupled with an attractive price.
