NASDAQ:NXT is probably undervalued for the fundamentals it is displaying.
By Mill Chart
Last update: Feb 4, 2025
Uncover the potential of NEXTRACKER INC-CL A (NASDAQ:NXT) as our stock screener's choice for an undervalued stock. NASDAQ:NXT maintains a strong financial position and offers an appealing valuation. We'll delve into the specifics below.
Evaluating Valuation: NASDAQ:NXT
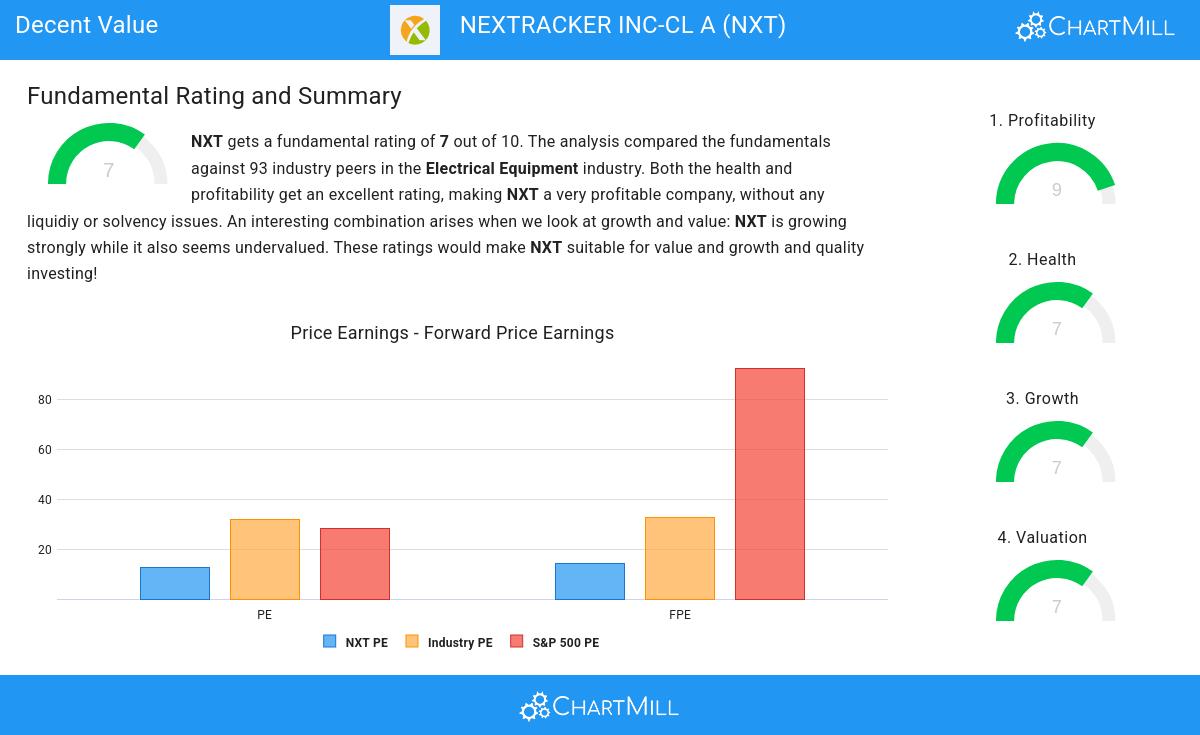
ChartMill provides a Valuation Rating to every stock, ranging from 0 to 10. This rating assesses various valuation aspects, comparing price to earnings and cash flows, while considering factors like profitability and growth. NASDAQ:NXT boasts a 7 out of 10:
- Based on the Price/Earnings ratio, NXT is valued cheaper than 89.13% of the companies in the same industry.
- When comparing the Price/Earnings ratio of NXT to the average of the S&P500 Index (28.36), we can say NXT is valued rather cheaply.
- Based on the Price/Forward Earnings ratio, NXT is valued cheaply inside the industry as 88.04% of the companies are valued more expensively.
- NXT is valuated cheaply when we compare the Price/Forward Earnings ratio to 92.49, which is the current average of the S&P500 Index.
- Based on the Enterprise Value to EBITDA ratio, NXT is valued cheaply inside the industry as 91.30% of the companies are valued more expensively.
- Based on the Price/Free Cash Flow ratio, NXT is valued cheaply inside the industry as 89.13% of the companies are valued more expensively.
- The excellent profitability rating of NXT may justify a higher PE ratio.
Exploring NASDAQ:NXT's Profitability
ChartMill assigns a proprietary Profitability Rating to each stock. The score is computed by evaluating various profitability ratios and margins and ranges from 0 to 10. NASDAQ:NXT was assigned a score of 9 for profitability:
- NXT has a Return On Assets of 18.75%. This is amongst the best in the industry. NXT outperforms 98.91% of its industry peers.
- NXT's Return On Equity of 39.27% is amongst the best of the industry. NXT outperforms 98.91% of its industry peers.
- NXT has a Return On Invested Capital of 26.48%. This is amongst the best in the industry. NXT outperforms 97.83% of its industry peers.
- Measured over the past 3 years, the Average Return On Invested Capital for NXT is significantly above the industry average of 10.19%.
- The last Return On Invested Capital (26.48%) for NXT is above the 3 year average (17.04%), which is a sign of increasing profitability.
- NXT has a Profit Margin of 20.19%. This is amongst the best in the industry. NXT outperforms 98.91% of its industry peers.
- In the last couple of years the Profit Margin of NXT has grown nicely.
- NXT's Operating Margin of 25.91% is amongst the best of the industry. NXT outperforms 100.00% of its industry peers.
- NXT's Operating Margin has improved in the last couple of years.
- With an excellent Gross Margin value of 37.66%, NXT belongs to the best of the industry, outperforming 88.04% of the companies in the same industry.
- In the last couple of years the Gross Margin of NXT has grown nicely.
Health Examination for NASDAQ:NXT
ChartMill assigns a Health Rating to every stock. This score ranges from 0 to 10 and evaluates the different health aspects like liquidity and solvency, both absolutely, but also relative to the industry peers. NASDAQ:NXT scores a 7 out of 10:
- NXT has a debt to FCF ratio of 0.29. This is a very positive value and a sign of high solvency as it would only need 0.29 years to pay back of all of its debts.
- Looking at the Debt to FCF ratio, with a value of 0.29, NXT belongs to the top of the industry, outperforming 94.57% of the companies in the same industry.
- A Debt/Equity ratio of 0.10 indicates that NXT is not too dependend on debt financing.
- NXT has a Debt to Equity ratio of 0.10. This is in the better half of the industry: NXT outperforms 63.04% of its industry peers.
- NXT has a Current Ratio of 2.20. This indicates that NXT is financially healthy and has no problem in meeting its short term obligations.
- Looking at the Current ratio, with a value of 2.20, NXT is in the better half of the industry, outperforming 63.04% of the companies in the same industry.
- Looking at the Quick ratio, with a value of 1.96, NXT is in the better half of the industry, outperforming 78.26% of the companies in the same industry.
What does the Growth looks like for NASDAQ:NXT
Every stock receives a Growth Rating from ChartMill, ranging from 0 to 10. This rating assesses various growth aspects, including historical and projected EPS and revenue growth. NASDAQ:NXT boasts a 7 out of 10:
- NXT shows a strong growth in Earnings Per Share. In the last year, the EPS has been growing by 57.49%, which is quite impressive.
- Looking at the last year, NXT shows a very strong growth in Revenue. The Revenue has grown by 21.46%.
- NXT shows a strong growth in Revenue. Measured over the last years, the Revenue has been growing by 30.49% yearly.
- NXT is expected to show quite a strong growth in Revenue. In the coming years, the Revenue will grow by 10.99% yearly.
- The EPS growth rate is accelerating: in the next years the growth will be better than in the last years.
Our Decent Value screener lists more Decent Value stocks and is updated daily.
For an up to date full fundamental analysis you can check the fundamental report of NXT
Keep in mind
This is not investing advice! The article highlights some of the observations at the time of writing, but you should always make your own analysis and invest based on your own insights.
41.56
-0.53 (-1.26%)
Find more stocks in the Stock Screener
NXT Latest News and Analysis
 13 days ago - ChartmillNASDAQ:NXT appears to be flying under the radar despite its strong fundamentals.
NEXTRACKER INC-CL A is a hidden gem, featuring undervaluation and robust fundamentals. NASDAQ:NXT showcases decent financial health and profitability, coupled with an attractive price.
 17 days ago - ChartmillInvestors seeking growth at a reasonable cost should explore NASDAQ:NXT.
Discover NEXTRACKER INC-CL A, an undervalued growth gem. NASDAQ:NXT is shining in terms of growth metrics, and it's also displaying strong financial health and profitability, retaining an appealing valuation.
