NASDAQ:NXT appears to be flying under the radar despite its strong fundamentals.
By Mill Chart
Last update: Feb 25, 2025
Our stock screening tool has identified NEXTRACKER INC-CL A (NASDAQ:NXT) as an undervalued gem with strong fundamentals. NASDAQ:NXT boasts decent financial health and profitability while maintaining an attractive price point. We'll break it down further.
Looking at the Valuation
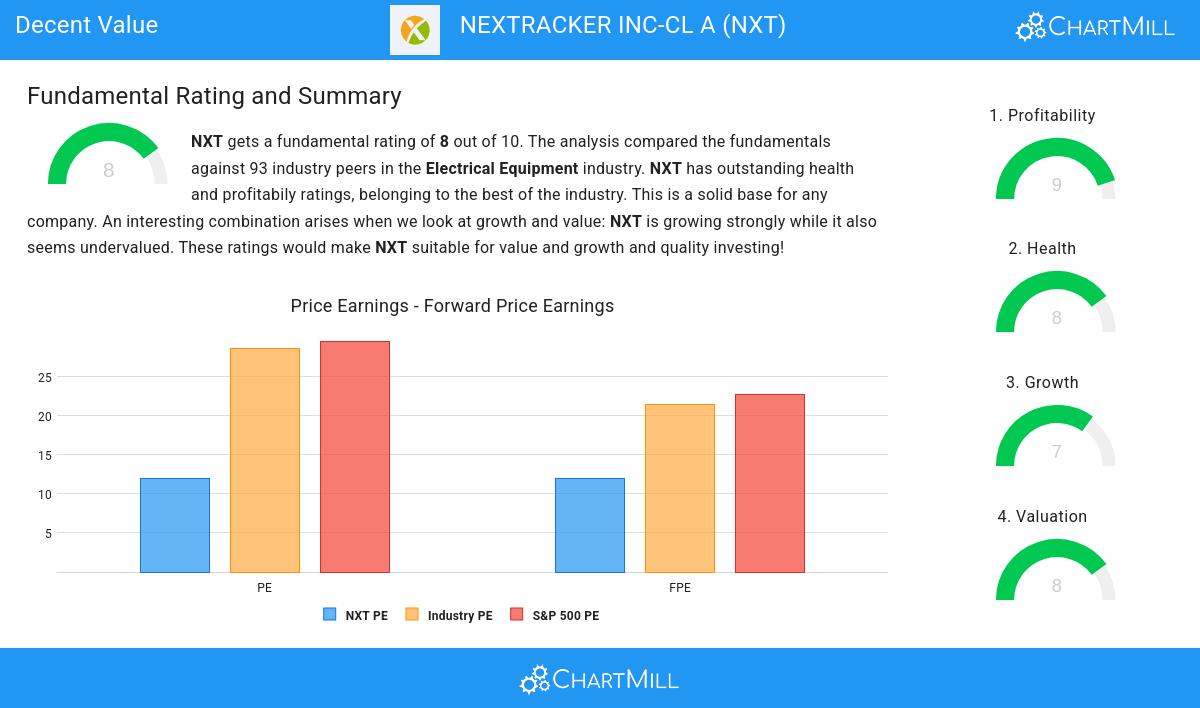
ChartMill assigns a proprietary Valuation Rating to each stock. The score is computed by evaluating various valuation aspects, like price to earnings and free cash flow, both absolutely as relative to the market and industry. NASDAQ:NXT was assigned a score of 8 for valuation:
- Based on the Price/Earnings ratio, NXT is valued cheaper than 90.22% of the companies in the same industry.
- Compared to an average S&P500 Price/Earnings ratio of 29.53, NXT is valued rather cheaply.
- With a Price/Forward Earnings ratio of 11.99, the valuation of NXT can be described as very reasonable.
- 86.96% of the companies in the same industry are more expensive than NXT, based on the Price/Forward Earnings ratio.
- When comparing the Price/Forward Earnings ratio of NXT to the average of the S&P500 Index (22.65), we can say NXT is valued slightly cheaper.
- 91.30% of the companies in the same industry are more expensive than NXT, based on the Enterprise Value to EBITDA ratio.
- Based on the Price/Free Cash Flow ratio, NXT is valued cheaply inside the industry as 90.22% of the companies are valued more expensively.
- The low PEG Ratio(NY), which compensates the Price/Earnings for growth, indicates a rather cheap valuation of the company.
- The excellent profitability rating of NXT may justify a higher PE ratio.
A Closer Look at Profitability for NASDAQ:NXT
ChartMill's Profitability Rating offers a unique perspective on stock analysis, providing scores from 0 to 10. These ratings consider a wide range of profitability metrics and margins, both in comparison to industry peers and on their own merits. For NASDAQ:NXT, the assigned 9 is a significant indicator of profitability:
- NXT has a Return On Assets of 18.69%. This is amongst the best in the industry. NXT outperforms 100.00% of its industry peers.
- NXT has a Return On Equity of 39.64%. This is amongst the best in the industry. NXT outperforms 98.91% of its industry peers.
- Looking at the Return On Invested Capital, with a value of 26.41%, NXT belongs to the top of the industry, outperforming 97.83% of the companies in the same industry.
- NXT had an Average Return On Invested Capital over the past 3 years of 17.04%. This is significantly above the industry average of 10.21%.
- The 3 year average ROIC (17.04%) for NXT is below the current ROIC(26.41%), indicating increased profibility in the last year.
- NXT's Profit Margin of 20.12% is amongst the best of the industry. NXT outperforms 98.91% of its industry peers.
- In the last couple of years the Profit Margin of NXT has grown nicely.
- NXT's Operating Margin of 25.83% is amongst the best of the industry. NXT outperforms 100.00% of its industry peers.
- NXT's Operating Margin has improved in the last couple of years.
- NXT has a Gross Margin of 37.66%. This is amongst the best in the industry. NXT outperforms 88.04% of its industry peers.
- In the last couple of years the Gross Margin of NXT has grown nicely.
Evaluating Health: NASDAQ:NXT
ChartMill assigns a proprietary Health Rating to each stock. The score is computed by evaluating various liquidity and solvency ratios and ranges from 0 to 10. NASDAQ:NXT was assigned a score of 8 for health:
- An Altman-Z score of 3.47 indicates that NXT is not in any danger for bankruptcy at the moment.
- NXT has a better Altman-Z score (3.47) than 72.83% of its industry peers.
- NXT has a debt to FCF ratio of 0.29. This is a very positive value and a sign of high solvency as it would only need 0.29 years to pay back of all of its debts.
- With an excellent Debt to FCF ratio value of 0.29, NXT belongs to the best of the industry, outperforming 94.57% of the companies in the same industry.
- A Debt/Equity ratio of 0.10 indicates that NXT is not too dependend on debt financing.
- NXT's Debt to Equity ratio of 0.10 is fine compared to the rest of the industry. NXT outperforms 65.22% of its industry peers.
- A Current Ratio of 2.20 indicates that NXT has no problem at all paying its short term obligations.
- NXT has a better Current ratio (2.20) than 63.04% of its industry peers.
- The Quick ratio of NXT (1.96) is better than 76.09% of its industry peers.
Growth Insights: NASDAQ:NXT
To evaluate a stock's growth potential, ChartMill utilizes a Growth Rating on a scale of 0 to 10. This comprehensive assessment considers various growth aspects, including historical and estimated EPS and revenue growth. NASDAQ:NXT has achieved a 7 out of 10:
- The Earnings Per Share has grown by an impressive 57.49% over the past year.
- NXT shows a strong growth in Revenue. In the last year, the Revenue has grown by 21.46%.
- Measured over the past years, NXT shows a very strong growth in Revenue. The Revenue has been growing by 30.49% on average per year.
- Based on estimates for the next years, NXT will show a quite strong growth in Revenue. The Revenue will grow by 10.99% on average per year.
- When comparing the EPS growth rate of the last years to the growth rate of the upcoming years, we see that the growth is accelerating.
Every day, new Decent Value stocks can be found on ChartMill in our Decent Value screener.
Our latest full fundamental report of NXT contains the most current fundamental analsysis.
Keep in mind
This article should in no way be interpreted as advice. The article is based on the observed metrics at the time of writing, but you should always make your own analysis and trade or invest at your own responsibility.
40.3
+0.58 (+1.46%)
Find more stocks in the Stock Screener
NXT Latest News and Analysis
 11 days ago - ChartmillIn the world of growth stocks, NEXTRACKER INC-CL A (NASDAQ:NXT) shines as a value proposition.
Discover NEXTRACKER INC-CL A, an undervalued growth gem. NASDAQ:NXT is shining in terms of growth metrics, and it's also displaying strong financial health and profitability, retaining an appealing valuation.
 20 days ago - ChartmillNEXTRACKER INC-CL A (NASDAQ:NXT) is probably undervalued for the fundamentals it is displaying.
Discover NEXTRACKER INC-CL A, an undervalued stock. NASDAQ:NXT showcases solid financial health and profitability while maintaining an appealing valuation.
