
NVIDIA CORP (NASDAQ:NVDA) stands out as a growth opportunity that won't break the bank.
By Mill Chart
Last update: Mar 20, 2025
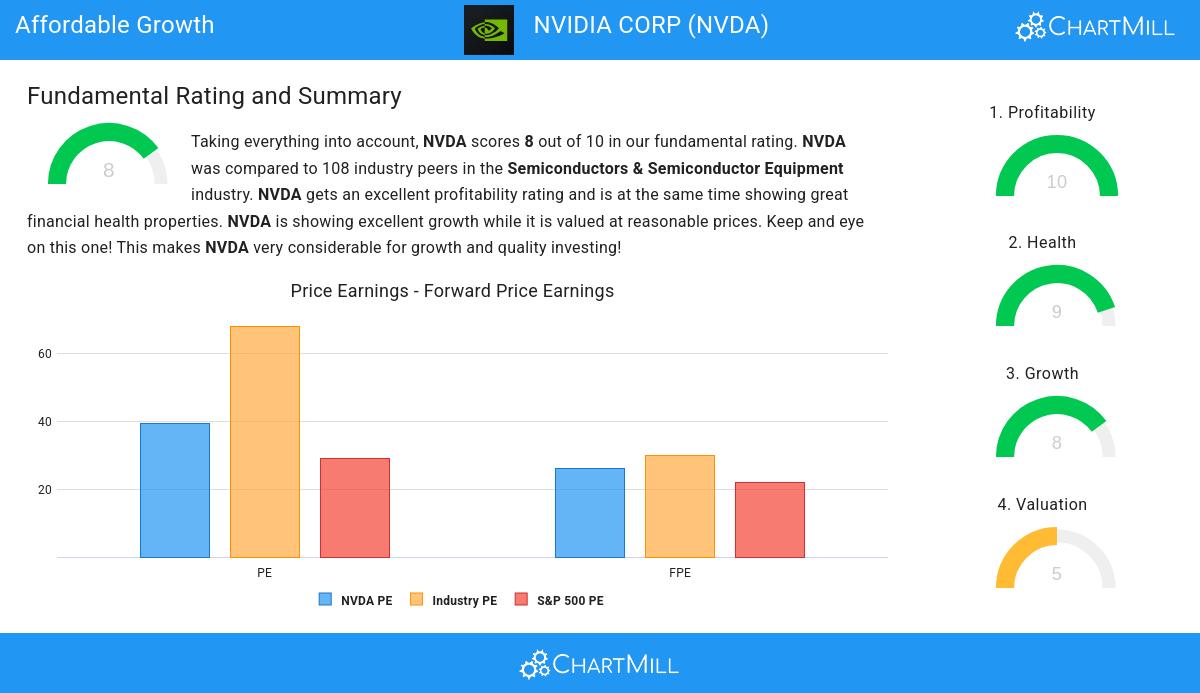
NVIDIA CORP (NASDAQ:NVDA) was identified as an affordable growth stock by our stock screener. NVDA is showing great growth, but also scores well on profitability, solvency and liquidity. At the same time it seems to be priced reasonably. We'll explore this a bit deeper below.
Assessing Growth Metrics for NVDA
A key component of ChartMill's stock assessment is the Growth Rating, which spans from 0 to 10. This rating evaluates diverse growth factors, such as EPS and revenue growth, considering both past performance and future projections. NVDA has received a 8 out of 10:
- NVDA shows a strong growth in Earnings Per Share. In the last year, the EPS has been growing by 130.69%, which is quite impressive.
- Measured over the past years, NVDA shows a very strong growth in Earnings Per Share. The EPS has been growing by 83.26% on average per year.
- Looking at the last year, NVDA shows a very strong growth in Revenue. The Revenue has grown by 114.20%.
- The Revenue has been growing by 64.24% on average over the past years. This is a very strong growth!
- NVDA is expected to show quite a strong growth in Earnings Per Share. In the coming years, the EPS will grow by 19.05% yearly.
- NVDA is expected to show quite a strong growth in Revenue. In the coming years, the Revenue will grow by 19.11% yearly.
A Closer Look at Valuation for NVDA
An integral part of ChartMill's stock analysis is the Valuation Rating, which spans from 0 to 10. This rating evaluates diverse valuation factors, including price to earnings and cash flows, while considering the stock's profitability and growth. NVDA has received a 5 out of 10:
- NVDA's Price/Free Cash Flow ratio is a bit cheaper when compared to the industry. NVDA is cheaper than 63.89% of the companies in the same industry.
- NVDA's low PEG Ratio(NY), which compensates the Price/Earnings for growth, indicates a rather cheap valuation of the company.
- NVDA has an outstanding profitability rating, which may justify a higher PE ratio.
- NVDA's earnings are expected to grow with 29.84% in the coming years. This may justify a more expensive valuation.
How We Gauge Health for NVDA
To gauge a stock's financial health, ChartMill utilizes a Health Rating on a scale of 0 to 10. This comprehensive evaluation encompasses liquidity and solvency, both in absolute terms and in comparison to industry peers. NVDA has earned a 9 out of 10:
- NVDA has an Altman-Z score of 58.43. This indicates that NVDA is financially healthy and has little risk of bankruptcy at the moment.
- NVDA has a better Altman-Z score (58.43) than 98.15% of its industry peers.
- NVDA has a debt to FCF ratio of 0.14. This is a very positive value and a sign of high solvency as it would only need 0.14 years to pay back of all of its debts.
- With an excellent Debt to FCF ratio value of 0.14, NVDA belongs to the best of the industry, outperforming 85.19% of the companies in the same industry.
- A Debt/Equity ratio of 0.11 indicates that NVDA is not too dependend on debt financing.
- A Current Ratio of 4.44 indicates that NVDA has no problem at all paying its short term obligations.
- NVDA's Current ratio of 4.44 is fine compared to the rest of the industry. NVDA outperforms 68.52% of its industry peers.
- A Quick Ratio of 3.88 indicates that NVDA has no problem at all paying its short term obligations.
- NVDA has a better Quick ratio (3.88) than 72.22% of its industry peers.
Assessing Profitability for NVDA
ChartMill's Profitability Rating offers a unique perspective on stock analysis, providing scores from 0 to 10. These ratings consider a wide range of profitability metrics and margins, both in comparison to industry peers and on their own merits. For NVDA, the assigned 10 is a significant indicator of profitability:
- NVDA has a Return On Assets of 65.30%. This is amongst the best in the industry. NVDA outperforms 99.07% of its industry peers.
- NVDA's Return On Equity of 91.87% is amongst the best of the industry. NVDA outperforms 99.07% of its industry peers.
- The Return On Invested Capital of NVDA (76.63%) is better than 100.00% of its industry peers.
- The Average Return On Invested Capital over the past 3 years for NVDA is significantly above the industry average of 11.36%.
- The 3 year average ROIC (48.58%) for NVDA is below the current ROIC(76.63%), indicating increased profibility in the last year.
- NVDA has a Profit Margin of 55.85%. This is amongst the best in the industry. NVDA outperforms 97.22% of its industry peers.
- NVDA's Profit Margin has improved in the last couple of years.
- Looking at the Operating Margin, with a value of 62.88%, NVDA belongs to the top of the industry, outperforming 100.00% of the companies in the same industry.
- In the last couple of years the Operating Margin of NVDA has grown nicely.
- Looking at the Gross Margin, with a value of 75.45%, NVDA belongs to the top of the industry, outperforming 92.59% of the companies in the same industry.
- NVDA's Gross Margin has improved in the last couple of years.
More Affordable Growth stocks can be found in our Affordable Growth screener.
For an up to date full fundamental analysis you can check the fundamental report of NVDA
Disclaimer
This is not investing advice! The article highlights some of the observations at the time of writing, but you should always make your own analysis and invest based on your own insights.
104.49
-7.71 (-6.87%)
Find more stocks in the Stock Screener
NVDA Latest News and Analysis
 5 hours ago - ChartmillStay informed with the top movers within the S&P500 index on Wednesday.
Let's delve into the developments on the US markets one hour before the close of the markets on Wednesday. Below, you'll find the top gainers and losers within the S&P500 index during today's session.
 6 hours ago - ChartmillMost active S&P500 stocks in Wednesday's session
Stay informed about the most active S&P500 stocks in today's session as we take a closer look at what's happening on the US markets on Wednesday. Discover the stocks that are generating the highest trading volume and driving market activity.
6 hours ago - ChartmillMost active stocks in Wednesday's sessionCurious about the most active stocks in today's session? Get a glimpse into the stocks that are generating the highest trading volume and capturing market attention.
8 hours ago - ChartmillDiscover which S&P500 stocks are making waves on Wednesday.Let's delve into the developments on the US markets in the middle of the day on Wednesday. Below, you'll find the top gainers and losers within the S&P500 index during today's session.
 10 hours ago - ChartmillWednesday's session: gap up and gap down stock in the S&P500 index
Let's take a look at the S&P500 stocks that are experiencing notable price gaps in today's session on Wednesday. Discover the gap up and gap down stocks in the S&P500 index.
 12 hours ago - ChartmillWednesday's pre-market session: top gainers and losers in the S&P500 index
Before the US market kicks off on Wednesday, let's examine the pre-market session and unveil the notable performers among the S&P500 top gainers and losers.
 13 hours ago - ChartmillDelving into NVIDIA CORP (NASDAQ:NVDA)'s Growth Prospects.
A fundamental analysis of (NASDAQ:NVDA): Is NVIDIA CORP (NASDAQ:NVDA) a Fit for Growth Investing Strategies?
 20 hours ago - ChartmillMarket Monitor April 16 ( Netflix, Palantir UP, Nvidia, Applied Digital DOWN)
Calm Trading on Wall Street as Netflix Shines, Nvidia Stumbles after-hours
a day ago - ChartmillMost active S&P500 stocks in Tuesday's sessionStay informed about the most active S&P500 stocks in today's session as we take a closer look at what's happening on the US markets on Tuesday. Discover the stocks that are generating the highest trading volume and driving market activity.
a day ago - ChartmillCurious about the most active stocks on Tuesday?Discover the most active stocks in Tuesday's session. Stay informed about the stocks that are generating the most trading volume!
2 days ago - ChartmillWhat's going on in today's session: S&P500 most active stocksExplore the S&P500 index on Monday and find out which stocks are the most active in today's session. Stay updated with the stocks that are capturing market interest.
2 days ago - ChartmillMost active stocks in Monday's sessionLet's dive into the action on the US markets on Monday. Here are the most active stocks that are driving the market today.
