
Delving into NVIDIA CORP (NASDAQ:NVDA)'s Growth Prospects.
By Mill Chart
Last update: Apr 16, 2025
In this article we will dive into NVIDIA CORP (NASDAQ:NVDA) as a possible candidate for growth investing. Investors should always do their own research, but we noticed NVIDIA CORP showing up in our CANSLIM growth screen, which makes it worth to investigate a bit more.
Looking into the canslim metrics of NVIDIA CORP
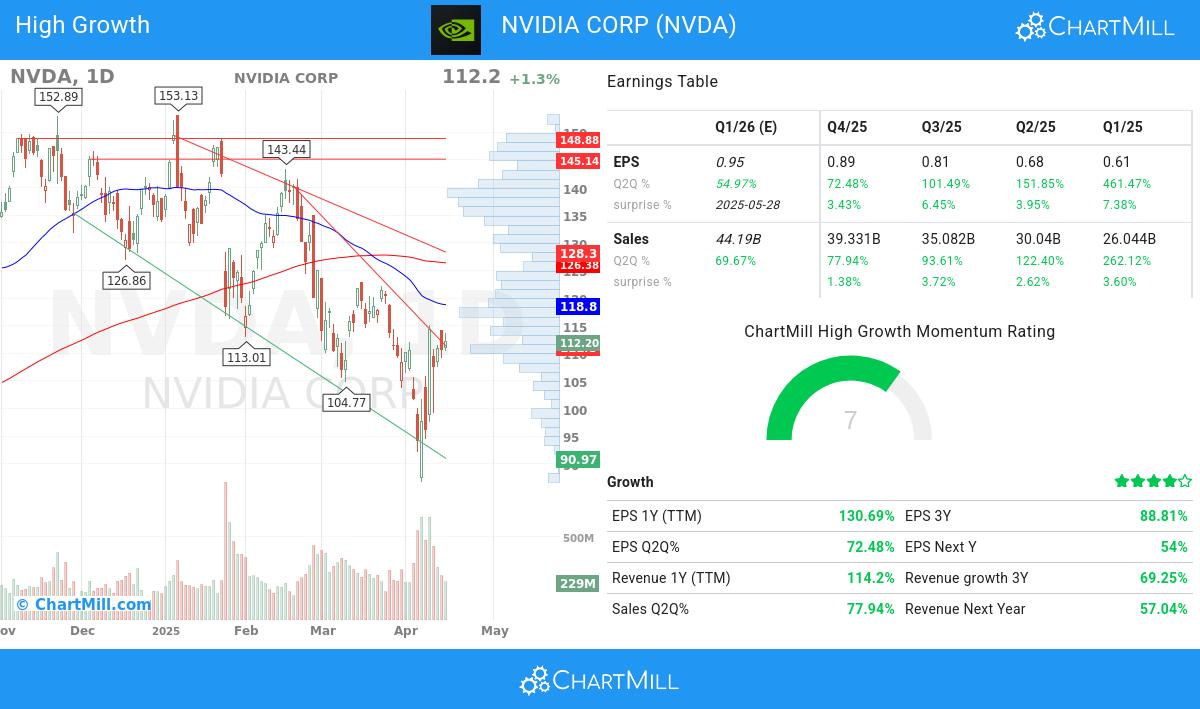
- NVDA has shown positive momentum in its earnings per share (EPS) on a quarter-to-quarter (Q2Q) basis, with a 72.48% increase. This reflects the company's successful execution of its business strategies and its commitment to delivering improved financial results.
- NVDA has demonstrated strong quarter-to-quarter (Q2Q) revenue growth of 77.94%, reflecting its ability to generate consistent increases in sales. This growth highlights the company's effective market positioning and its potential for continued success.
- Over the past 3 years, NVDA has demonstrated 88.81% growth in EPS, signifying its positive financial trajectory and potential for future profitability.
- The Return on Equity (ROE) of NVDA stands at 91.87%, reflecting the company's strong profitability and effective utilization of shareholder equity. This metric signifies the company's ability to generate returns for its investors.
- The Relative Strength (RS) of NVDA has consistently been strong, with a current 89.38 rating. This indicates the stock's ability to exhibit relative price outperformance and reflects its competitive strength.
- NVDA exhibits a favorable Debt-to-Equity ratio at 0.11. This highlights the company's ability to limit excessive debt levels and maintain a strong equity base, demonstrating its financial stability and risk management practices.
- The ownership composition of NVDA reflects a balanced investor ecosystem, with institutional shareholders owning 67.04%. This indicates a broader market participation and potential for increased trading liquidity.
Deciphering the Technical Picture of NVDA
ChartMill assigns a proprietary Technical Rating to each stock. The score is computed daily by evaluating various technical indicators and properties. The score ranges from 0 to 10.
We assign a technical rating of 2 out of 10 to NVDA. Although NVDA is scoring some points because its good overall performance in the market in the past year, recent evolutions are not that positive. Both the medium and short term picture give negative signs.
- NVDA is part of the Semiconductors & Semiconductor Equipment industry. There are 109 other stocks in this industry. NVDA outperforms 93% of them.
- In the last month NVDA has a been trading in the 86.62 - 122.22 range, which is quite wide. It is currently trading near the high of this range.
- Looking at the yearly performance, NVDA did better than 89% of all other stocks. However, this overall performance is mostly based on the strong move around 10 months ago.
- NVDA is currently trading in the middle of its 52 week range. This is in line with the S&P500 Index, which is also trading in the middle of its range.
- Prices have been rising strongly lately, it may be a good idea to wait for a consolidation or pullback before considering an entry.
Our latest full technical report of NVDA contains the most current technical analsysis.
Zooming in on the fundamentals.
At ChartMill, a crucial aspect of their analysis is the assignment of a Fundamental Rating to each stock. This rating, ranging from 0 to 10, is calculated daily by considering numerous fundamental indicators and properties.
NVDA gets a fundamental rating of 8 out of 10. The analysis compared the fundamentals against 109 industry peers in the Semiconductors & Semiconductor Equipment industry. Both the health and profitability get an excellent rating, making NVDA a very profitable company, without any liquidiy or solvency issues. NVDA is not priced too expensively while it is growing strongly. Keep and eye on this one! These ratings would make NVDA suitable for growth and quality investing!
Check the latest full fundamental report of NVDA for a complete fundamental analysis.
Our CANSLIM screen will find you more ideas suited for growth investing.
Keep in mind
Important Note: The content of this article is not intended as trading advice. It is essential to perform your own analysis and exercise caution when making trading decisions. The article presents observations created by automated analysis but does not guarantee any trading or investment outcomes. Always trade responsibly and make independent judgments.
101.49
-3 (-2.87%)
Find more stocks in the Stock Screener
NVDA Latest News and Analysis
 6 hours ago - ChartmillMarket Monitor April 18 ( Eli Lilly, Netflix UP, United Health Group, Manpower DOWN)
Wall Street Mostly Lower Amid Trump-Fed Tensions, Nvidia’s Continued Slide
 19 hours ago - ChartmillStay informed with the top movers within the S&P500 index on Thursday.
Stay updated with the movement of S&P500 stocks in today's session. Discover which S&P500 stocks are making waves on Thursday.
 20 hours ago - ChartmillThursday's session: most active stock in the S&P500 index
Looking for the most active S&P500 stocks in today's session? Join us as we dive into the US markets on Thursday and discover the stocks that are dominating the trading activity and setting the pace for the market.
20 hours ago - ChartmillMost active stocks in Thursday's sessionThursday's session is buzzing with activity. Check out the stocks that are attracting the most attention and driving market activity!
22 hours ago - ChartmillWhat's going on in today's session: S&P500 moversStay updated with the movement of S&P500 stocks in today's session. Discover which S&P500 stocks are making waves on Thursday.
 a day ago - ChartmillMarket Monitor April 17 ( Hertz UP, Nvidia, AMD DOWN)
Wall Street Tumbles as Powell Dashes Rate-Cut Hopes, Nvidia Sinks on Export Restrictions
2 days ago - ChartmillStay informed with the top movers within the S&P500 index on Wednesday.Let's delve into the developments on the US markets one hour before the close of the markets on Wednesday. Below, you'll find the top gainers and losers within the S&P500 index during today's session.
2 days ago - ChartmillMost active S&P500 stocks in Wednesday's sessionStay informed about the most active S&P500 stocks in today's session as we take a closer look at what's happening on the US markets on Wednesday. Discover the stocks that are generating the highest trading volume and driving market activity.
2 days ago - ChartmillMost active stocks in Wednesday's sessionCurious about the most active stocks in today's session? Get a glimpse into the stocks that are generating the highest trading volume and capturing market attention.
2 days ago - ChartmillDiscover which S&P500 stocks are making waves on Wednesday.Let's delve into the developments on the US markets in the middle of the day on Wednesday. Below, you'll find the top gainers and losers within the S&P500 index during today's session.
 2 days ago - ChartmillWednesday's session: gap up and gap down stock in the S&P500 index
Let's take a look at the S&P500 stocks that are experiencing notable price gaps in today's session on Wednesday. Discover the gap up and gap down stocks in the S&P500 index.
 2 days ago - ChartmillWednesday's pre-market session: top gainers and losers in the S&P500 index
Before the US market kicks off on Wednesday, let's examine the pre-market session and unveil the notable performers among the S&P500 top gainers and losers.
