
NASDAQ:NVDA—Positioned as a High-Growth Stock, Ready for a Potential Breakout.
By Mill Chart
Last update: Jan 16, 2025
Growth investors are on the lookout for stocks displaying robust revenue and EPS growth. In this analysis, we'll assess whether NVIDIA CORP (NASDAQ:NVDA) aligns with growth investing criteria, especially as it consolidates and signals a possible breakout. As always, investors should conduct their own research, but NVIDIA CORP has surfaced on our radar for growth with base formation, warranting further examination.
Growth Assessment of NASDAQ:NVDA
ChartMill assigns a proprietary Growth Rating to each stock. The score is computed by evaluating various growth aspects, like EPS and revenue growth. We take into account the history as well as the estimated future numbers. NASDAQ:NVDA was assigned a score of 9 for growth:
- NVDA shows a strong growth in Earnings Per Share. In the last year, the EPS has been growing by 201.27%, which is quite impressive.
- Measured over the past years, NVDA shows a very strong growth in Earnings Per Share. The EPS has been growing by 50.90% on average per year.
- The Revenue has grown by 152.44% in the past year. This is a very strong growth!
- The Revenue has been growing by 39.06% on average over the past years. This is a very strong growth!
- Based on estimates for the next years, NVDA will show a very strong growth in Earnings Per Share. The EPS will grow by 35.63% on average per year.
- Based on estimates for the next years, NVDA will show a very strong growth in Revenue. The Revenue will grow by 35.61% on average per year.
Understanding NASDAQ:NVDA's Health
To gauge a stock's financial health, ChartMill utilizes a Health Rating on a scale of 0 to 10. This comprehensive evaluation encompasses liquidity and solvency, both in absolute terms and in comparison to industry peers. NASDAQ:NVDA has earned a 8 out of 10:
- An Altman-Z score of 71.53 indicates that NVDA is not in any danger for bankruptcy at the moment.
- With an excellent Altman-Z score value of 71.53, NVDA belongs to the best of the industry, outperforming 97.22% of the companies in the same industry.
- The Debt to FCF ratio of NVDA is 0.15, which is an excellent value as it means it would take NVDA, only 0.15 years of fcf income to pay off all of its debts.
- NVDA has a Debt to FCF ratio of 0.15. This is amongst the best in the industry. NVDA outperforms 85.19% of its industry peers.
- A Debt/Equity ratio of 0.13 indicates that NVDA is not too dependend on debt financing.
- NVDA has a Current Ratio of 4.10. This indicates that NVDA is financially healthy and has no problem in meeting its short term obligations.
- NVDA has a better Current ratio (4.10) than 65.74% of its industry peers.
- NVDA has a Quick Ratio of 3.64. This indicates that NVDA is financially healthy and has no problem in meeting its short term obligations.
- NVDA has a better Quick ratio (3.64) than 69.44% of its industry peers.
Exploring NASDAQ:NVDA's Profitability
ChartMill's Profitability Rating offers a unique perspective on stock analysis, providing scores from 0 to 10. These ratings consider a wide range of profitability metrics and margins, both in comparison to industry peers and on their own merits. For NASDAQ:NVDA, the assigned 10 is a significant indicator of profitability:
- Looking at the Return On Assets, with a value of 65.69%, NVDA belongs to the top of the industry, outperforming 99.07% of the companies in the same industry.
- NVDA's Return On Equity of 95.71% is amongst the best of the industry. NVDA outperforms 100.00% of its industry peers.
- NVDA has a Return On Invested Capital of 78.60%. This is amongst the best in the industry. NVDA outperforms 100.00% of its industry peers.
- Measured over the past 3 years, the Average Return On Invested Capital for NVDA is significantly above the industry average of 11.84%.
- The 3 year average ROIC (31.07%) for NVDA is below the current ROIC(78.60%), indicating increased profibility in the last year.
- With an excellent Profit Margin value of 55.69%, NVDA belongs to the best of the industry, outperforming 98.15% of the companies in the same industry.
- In the last couple of years the Profit Margin of NVDA has grown nicely.
- Looking at the Operating Margin, with a value of 62.71%, NVDA belongs to the top of the industry, outperforming 99.07% of the companies in the same industry.
- NVDA's Operating Margin has improved in the last couple of years.
- NVDA has a Gross Margin of 75.86%. This is amongst the best in the industry. NVDA outperforms 94.44% of its industry peers.
- NVDA's Gross Margin has improved in the last couple of years.
Looking at the Setup
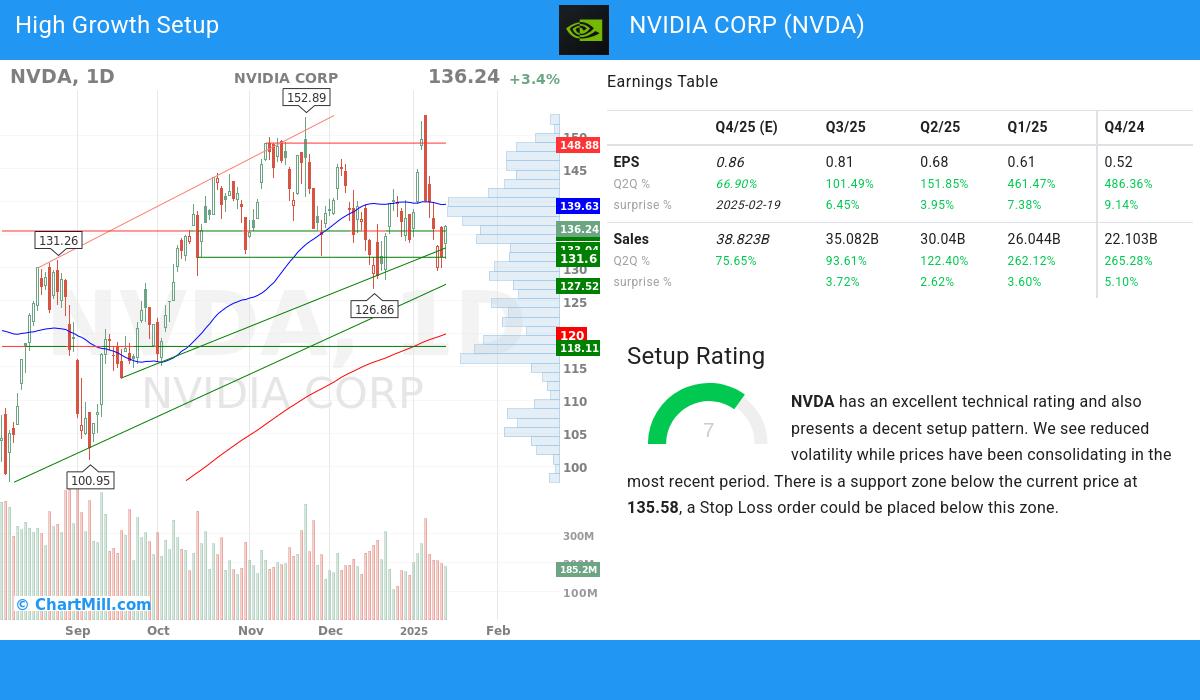
Besides the Technical Rating, ChartMill also assign a Setup Rating to every stock. This setup score also ranges from 0 to 10 and determines to which extend the stock is consolidating. This is achieved by evaluating multiple short term technical indicators. NASDAQ:NVDA currently has a 7 as setup rating:
NVDA has an excellent technical rating and also presents a decent setup pattern. Prices have been consolidating lately and the volatility has been reduced. There is a support zone below the current price at 135.58, a Stop Loss order could be placed below this zone.
Every day, new Strong Growth stocks can be found on ChartMill in our Strong Growth screener.
Our latest full fundamental report of NVDA contains the most current fundamental analsysis.
Check the latest full technical report of NVDA for a complete technical analysis.
Disclaimer
This is not investing advice! The article highlights some of the observations at the time of writing, but you should always make your own analysis and invest based on your own insights.
134.43
-5.68 (-4.05%)
Find more stocks in the Stock Screener
NVDA Latest News and Analysis
 6 hours ago - ChartmillThese S&P500 stocks are the most active in today's session
Let's have a look at what is happening on the US markets on Friday. Below you can find the most active S&P500 stocks in today's session.
6 hours ago - ChartmillThese stocks are the most active in today's sessionFriday's session is buzzing with activity. Check out the stocks that are attracting the most attention and driving market activity!
a day ago - ChartmillCurious about the most active S&P500 stocks in today's session?Explore the S&P500 index on Thursday and find out which stocks are the most active in today's session. Stay updated with the stocks that are capturing market interest and driving market movements.
a day ago - ChartmillThursday's session: most active stocksThese stocks are making the most noise in today's session. Stay tuned for the latest updates!
2 days ago - ChartmillWhich S&P500 stocks are the most active on Wednesday?Stay informed about the most active stocks in the S&P500 index on Wednesday's session. Discover the stocks that are generating the highest trading volume and driving market activity.
2 days ago - ChartmillDiscover the most active stocks in Wednesday's session.Curious about the most active stocks in today's session? Get a glimpse into the stocks that are generating the highest trading volume and capturing market attention.
3 days ago - ChartmillWhich S&P500 stocks are the most active on Tuesday?Let's have a look at what is happening on the US markets on Tuesday. Below you can find the most active S&P500 stocks in today's session.
3 days ago - ChartmillThese stocks are making the most noise in today's session.Discover the most active stocks in Tuesday's session. Stay informed about the stocks that are generating the most trading volume!
 5 days ago - ChartmillIs NVIDIA CORP (NASDAQ:NVDA) a Strong Candidate for Quality Investing?
A fundamental analysis of (NASDAQ:NVDA): Should Quality Investors Include NASDAQ:NVDA in Their Portfolio?
7 days ago - ChartmillWhich S&P500 stocks are the most active on Friday?Looking for the most active S&P500 stocks in today's session? Join us as we dive into the US markets on Friday and discover the stocks that are dominating the trading activity and setting the pace for the market.
7 days ago - ChartmillCheck out the stocks that are attracting the most attention and driving market activity.Curious about the most active stocks in today's session? Get a glimpse into the stocks that are generating the highest trading volume and capturing market attention.
8 days ago - ChartmillThursday's session: most active stock in the S&P500 indexCurious about the most active S&P500 stocks in today's session? Get insights into the stocks that are leading the way in terms of trading volume and market attention.
