
NASDAQ:NTES appears to be flying under the radar despite its strong fundamentals.
By Mill Chart
Last update: Oct 16, 2024
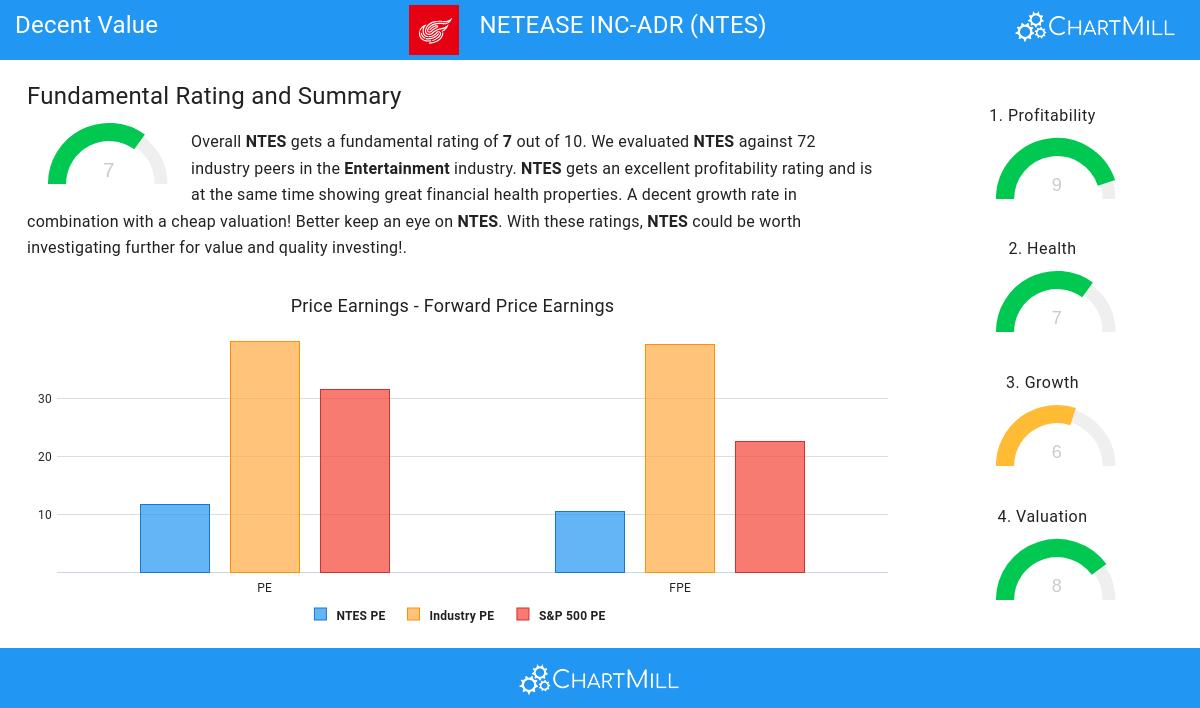
NETEASE INC-ADR (NASDAQ:NTES) has caught the attention of our stock screener as a great value stock. NASDAQ:NTES excels in profitability, solvency, and liquidity, all while being very reasonably priced. Let's delve into the details.
Valuation Insights: NASDAQ:NTES
ChartMill employs its own Valuation Rating system for all stocks. This score, ranging from 0 to 10, is determined by evaluating different valuation factors, including price to earnings and free cash flow, both in absolute terms and relative to the market and industry. NASDAQ:NTES has earned a 8 for valuation:
- With a Price/Earnings ratio of 11.72, the valuation of NTES can be described as very reasonable.
- NTES's Price/Earnings ratio is rather cheap when compared to the industry. NTES is cheaper than 88.57% of the companies in the same industry.
- When comparing the Price/Earnings ratio of NTES to the average of the S&P500 Index (31.61), we can say NTES is valued rather cheaply.
- The Price/Forward Earnings ratio is 10.39, which indicates a very decent valuation of NTES.
- Based on the Price/Forward Earnings ratio, NTES is valued cheaply inside the industry as 91.43% of the companies are valued more expensively.
- Compared to an average S&P500 Price/Forward Earnings ratio of 22.63, NTES is valued rather cheaply.
- Based on the Enterprise Value to EBITDA ratio, NTES is valued cheaper than 82.86% of the companies in the same industry.
- Based on the Price/Free Cash Flow ratio, NTES is valued cheaply inside the industry as 90.00% of the companies are valued more expensively.
- NTES has an outstanding profitability rating, which may justify a higher PE ratio.
A Closer Look at Profitability for NASDAQ:NTES
ChartMill utilizes a Profitability Rating to assess stocks, scoring them on a scale of 0 to 10. This rating takes into account a variety of profitability ratios and margins, both in absolute terms and in comparison to industry peers. NASDAQ:NTES has earned a 9 out of 10:
- NTES has a Return On Assets of 15.71%. This is amongst the best in the industry. NTES outperforms 94.29% of its industry peers.
- NTES has a Return On Equity of 22.01%. This is amongst the best in the industry. NTES outperforms 90.00% of its industry peers.
- NTES's Return On Invested Capital of 15.95% is amongst the best of the industry. NTES outperforms 94.29% of its industry peers.
- The last Return On Invested Capital (15.95%) for NTES is above the 3 year average (12.62%), which is a sign of increasing profitability.
- NTES has a better Profit Margin (26.99%) than 97.14% of its industry peers.
- NTES's Profit Margin has improved in the last couple of years.
- NTES has a better Operating Margin (27.21%) than 97.14% of its industry peers.
- In the last couple of years the Operating Margin of NTES has grown nicely.
- The Gross Margin of NTES (62.62%) is better than 72.86% of its industry peers.
- In the last couple of years the Gross Margin of NTES has grown nicely.
Understanding NASDAQ:NTES's Health
ChartMill employs a unique Health Rating system for all stocks. This rating, ranging from 0 to 10, is determined by analyzing various liquidity and solvency ratios. For NASDAQ:NTES, the assigned 7 for health provides valuable insights:
- The Debt to FCF ratio of NTES is 0.39, which is an excellent value as it means it would take NTES, only 0.39 years of fcf income to pay off all of its debts.
- NTES has a better Debt to FCF ratio (0.39) than 92.86% of its industry peers.
- A Debt/Equity ratio of 0.10 indicates that NTES is not too dependend on debt financing.
- NTES has a Debt to Equity ratio of 0.10. This is in the better half of the industry: NTES outperforms 70.00% of its industry peers.
- A Current Ratio of 3.01 indicates that NTES has no problem at all paying its short term obligations.
- NTES's Current ratio of 3.01 is amongst the best of the industry. NTES outperforms 81.43% of its industry peers.
- NTES has a Quick Ratio of 3.00. This indicates that NTES is financially healthy and has no problem in meeting its short term obligations.
- NTES has a better Quick ratio (3.00) than 81.43% of its industry peers.
Assessing Growth for NASDAQ:NTES
ChartMill assigns a proprietary Growth Rating to each stock. The score is computed by evaluating various growth aspects, like EPS and revenue growth. We take into account the history as well as the estimated future numbers. NASDAQ:NTES was assigned a score of 6 for growth:
- The Earnings Per Share has grown by an nice 12.67% over the past year.
- Measured over the past years, NTES shows a very strong growth in Earnings Per Share. The EPS has been growing by 39.56% on average per year.
- The Revenue has grown by 8.00% in the past year. This is quite good.
- NTES shows quite a strong growth in Revenue. Measured over the last years, the Revenue has been growing by 15.12% yearly.
- The Revenue is expected to grow by 9.53% on average over the next years. This is quite good.
Our Decent Value screener lists more Decent Value stocks and is updated daily.
Check the latest full fundamental report of NTES for a complete fundamental analysis.
Disclaimer
This is not investing advice! The article highlights some of the observations at the time of writing, but you should always make your own analysis and invest based on your own insights.