In the world of growth stocks, NASDAQ:NFLX shines as a value proposition.
By Mill Chart
Last update: Oct 1, 2024
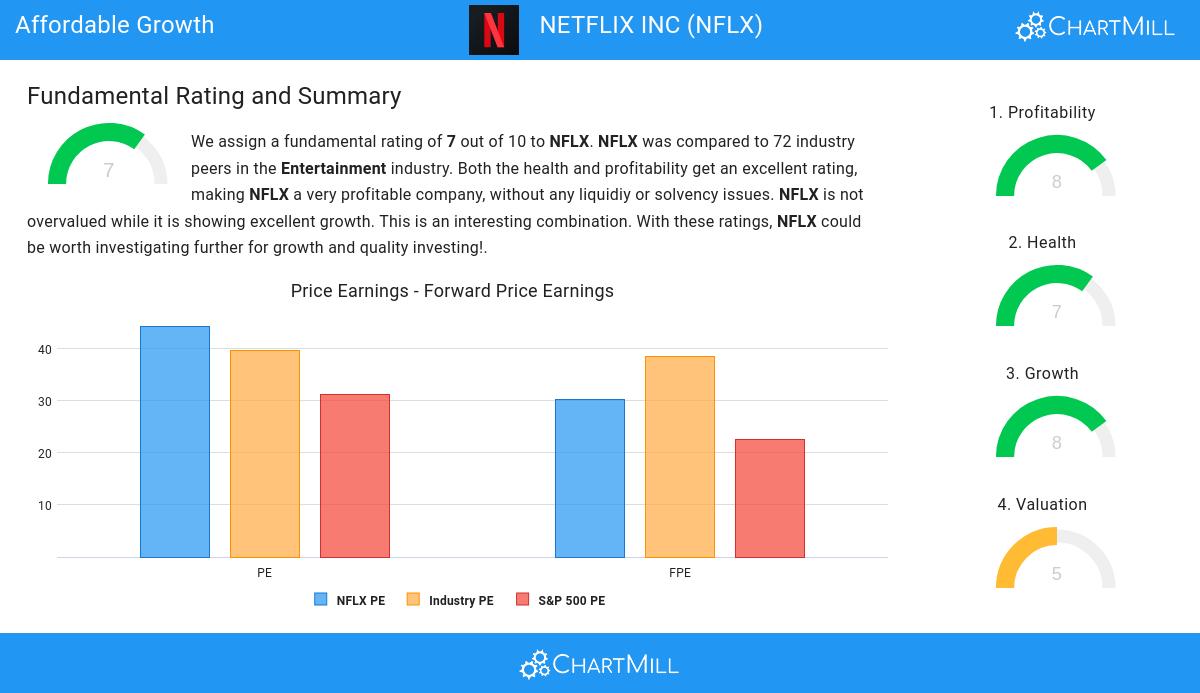
Consider NETFLIX INC (NASDAQ:NFLX) as an affordable growth stock, identified by our stock screening tool. NASDAQ:NFLX is showcasing impressive growth figures and is well-positioned in terms of profitability, solvency, and liquidity. Moreover, it seems to be priced reasonably. Let's dive deeper into the analysis.
A Closer Look at Growth for NASDAQ:NFLX
ChartMill assigns a Growth Rating to each stock, ranging from 0 to 10. This rating is determined by analyzing different growth elements, including EPS and revenue growth, spanning both historical and future figures. In the case of NASDAQ:NFLX, the assigned 8 reflects its growth potential:
- The Earnings Per Share has grown by an impressive 70.39% over the past year.
- The Earnings Per Share has been growing by 34.98% on average over the past years. This is a very strong growth
- The Revenue has grown by 13.00% in the past year. This is quite good.
- Measured over the past years, NFLX shows a quite strong growth in Revenue. The Revenue has been growing by 16.38% on average per year.
- NFLX is expected to show a strong growth in Earnings Per Share. In the coming years, the EPS will grow by 24.29% yearly.
- NFLX is expected to show quite a strong growth in Revenue. In the coming years, the Revenue will grow by 10.95% yearly.
Valuation Examination for NASDAQ:NFLX
To assess a stock's valuation, ChartMill utilizes a Valuation Rating on a scale of 0 to 10. This comprehensive assessment considers various valuation aspects, comparing price to earnings and cash flows, while factoring in profitability and growth. NASDAQ:NFLX has achieved a 5 out of 10:
- 70.00% of the companies in the same industry are more expensive than NFLX, based on the Price/Earnings ratio.
- Based on the Price/Forward Earnings ratio, NFLX is valued a bit cheaper than 70.00% of the companies in the same industry.
- NFLX's Enterprise Value to EBITDA ratio is a bit cheaper when compared to the industry. NFLX is cheaper than 68.57% of the companies in the same industry.
- 68.57% of the companies in the same industry are more expensive than NFLX, based on the Price/Free Cash Flow ratio.
- The low PEG Ratio(NY), which compensates the Price/Earnings for growth, indicates a rather cheap valuation of the company.
- NFLX has an outstanding profitability rating, which may justify a higher PE ratio.
- A more expensive valuation may be justified as NFLX's earnings are expected to grow with 32.56% in the coming years.
Health Assessment of NASDAQ:NFLX
ChartMill assigns a proprietary Health Rating to each stock. The score is computed by evaluating various liquidity and solvency ratios and ranges from 0 to 10. NASDAQ:NFLX was assigned a score of 7 for health:
- An Altman-Z score of 8.85 indicates that NFLX is not in any danger for bankruptcy at the moment.
- NFLX's Altman-Z score of 8.85 is amongst the best of the industry. NFLX outperforms 97.14% of its industry peers.
- The Debt to FCF ratio of NFLX is 2.05, which is a good value as it means it would take NFLX, 2.05 years of fcf income to pay off all of its debts.
- NFLX's Debt to FCF ratio of 2.05 is amongst the best of the industry. NFLX outperforms 84.29% of its industry peers.
- Even though the debt/equity ratio score it not favorable for NFLX, it has very limited outstanding debt, so we won't put too much weight on the DE evaluation.
- The current and quick ratio evaluation for NFLX is rather negative, while it does have excellent solvency and profitability. These ratios do not necessarly indicate liquidity issues and need to be evaluated against the specifics of the business.
Understanding NASDAQ:NFLX's Profitability
ChartMill utilizes a Profitability Rating to assess stocks, scoring them on a scale of 0 to 10. This rating takes into account a variety of profitability ratios and margins, both in absolute terms and in comparison to industry peers. NASDAQ:NFLX has earned a 8 out of 10:
- NFLX's Return On Assets of 14.45% is amongst the best of the industry. NFLX outperforms 92.86% of its industry peers.
- Looking at the Return On Equity, with a value of 32.08%, NFLX belongs to the top of the industry, outperforming 94.29% of the companies in the same industry.
- NFLX has a better Return On Invested Capital (18.37%) than 95.71% of its industry peers.
- The 3 year average ROIC (13.36%) for NFLX is below the current ROIC(18.37%), indicating increased profibility in the last year.
- NFLX has a better Profit Margin (19.54%) than 94.29% of its industry peers.
- NFLX's Profit Margin has improved in the last couple of years.
- NFLX has a Operating Margin of 23.82%. This is amongst the best in the industry. NFLX outperforms 94.29% of its industry peers.
- In the last couple of years the Operating Margin of NFLX has grown nicely.
- In the last couple of years the Gross Margin of NFLX has grown nicely.
More Affordable Growth stocks can be found in our Affordable Growth screener.
Our latest full fundamental report of NFLX contains the most current fundamental analsysis.
Disclaimer
Important Note: The content of this article is not intended as trading advice. It is essential to perform your own analysis and exercise caution when making trading decisions. The article presents observations created by automated analysis but does not guarantee any trading or investment outcomes. Always trade responsibly and make independent judgments.
NASDAQ:NFLX (2/20/2025, 10:03:09 AM)
1017.52
-25.81 (-2.47%)
Find more stocks in the Stock Screener
NFLX Latest News and Analysis
 20 days ago - ChartmillLooking for growth without the hefty price tag? Consider NASDAQ:NFLX.
Uncover the potential of NETFLIX INC, a growth stock reasonably priced. NASDAQ:NFLX is excelling in growth aspects, maintaining a healthy financial position, and still offers an attractive valuation.
