
Looking for growth without the hefty price tag? Consider NASDAQ:NFLX.
By Mill Chart
Last update: Jan 31, 2025
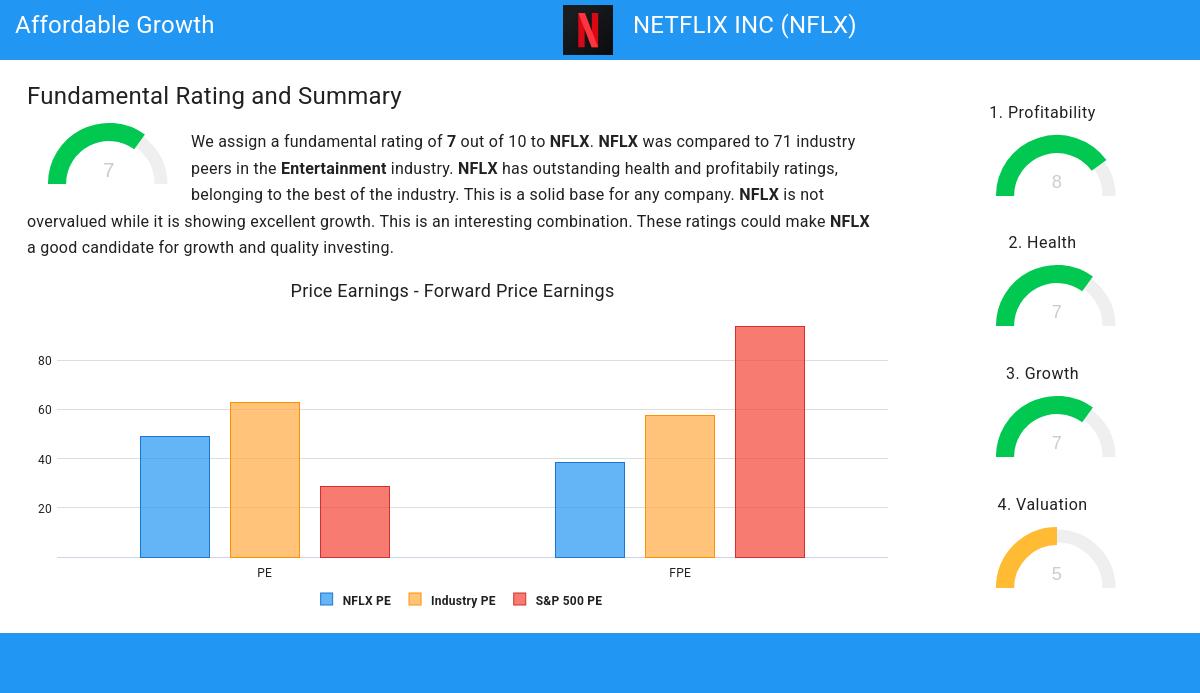
Our stock screener has singled out NETFLIX INC (NASDAQ:NFLX) as an attractive growth opportunity. NASDAQ:NFLX is demonstrating remarkable growth potential while maintaining strong financial indicators, making it a reasonably priced option. We'll explore this further.
Unpacking NASDAQ:NFLX's Growth Rating
Every stock receives a Growth Rating from ChartMill, ranging from 0 to 10. This rating assesses various growth aspects, including historical and projected EPS and revenue growth. NASDAQ:NFLX boasts a 7 out of 10:
- NFLX shows a strong growth in Earnings Per Share. In the last year, the EPS has been growing by 65.11%, which is quite impressive.
- The Earnings Per Share has been growing by 36.86% on average over the past years. This is a very strong growth
- Looking at the last year, NFLX shows a quite strong growth in Revenue. The Revenue has grown by 15.65% in the last year.
- NFLX shows quite a strong growth in Revenue. Measured over the last years, the Revenue has been growing by 14.11% yearly.
- Based on estimates for the next years, NFLX will show a quite strong growth in Earnings Per Share. The EPS will grow by 18.30% on average per year.
- Based on estimates for the next years, NFLX will show a quite strong growth in Revenue. The Revenue will grow by 10.85% on average per year.
Unpacking NASDAQ:NFLX's Valuation Rating
ChartMill provides a Valuation Rating to every stock, ranging from 0 to 10. This rating assesses various valuation aspects, comparing price to earnings and cash flows, while considering factors like profitability and growth. NASDAQ:NFLX boasts a 5 out of 10:
- NFLX's Price/Earnings ratio is a bit cheaper when compared to the industry. NFLX is cheaper than 66.67% of the companies in the same industry.
- 68.18% of the companies in the same industry are more expensive than NFLX, based on the Price/Forward Earnings ratio.
- When comparing the Price/Forward Earnings ratio of NFLX to the average of the S&P500 Index (93.88), we can say NFLX is valued rather cheaply.
- NFLX's Enterprise Value to EBITDA ratio is a bit cheaper when compared to the industry. NFLX is cheaper than 63.64% of the companies in the same industry.
- The excellent profitability rating of NFLX may justify a higher PE ratio.
- NFLX's earnings are expected to grow with 22.91% in the coming years. This may justify a more expensive valuation.
ChartMill's Evaluation of Health
ChartMill assigns a Health Rating to every stock. This score ranges from 0 to 10 and evaluates the different health aspects like liquidity and solvency, both absolutely, but also relative to the industry peers. NASDAQ:NFLX scores a 7 out of 10:
- An Altman-Z score of 11.12 indicates that NFLX is not in any danger for bankruptcy at the moment.
- NFLX has a better Altman-Z score (11.12) than 96.97% of its industry peers.
- The Debt to FCF ratio of NFLX is 2.25, which is a good value as it means it would take NFLX, 2.25 years of fcf income to pay off all of its debts.
- With a decent Debt to FCF ratio value of 2.25, NFLX is doing good in the industry, outperforming 78.79% of the companies in the same industry.
- Even though the debt/equity ratio score it not favorable for NFLX, it has very limited outstanding debt, so we won't put too much weight on the DE evaluation.
- NFLX does not score too well on the current and quick ratio evaluation. However, as it has excellent solvency and profitability, these ratios do not necessarly indicate liquidity issues and need to be evaluated against the specifics of the business.
Understanding NASDAQ:NFLX's Profitability
ChartMill assigns a proprietary Profitability Rating to each stock. The score is computed by evaluating various profitability ratios and margins and ranges from 0 to 10. NASDAQ:NFLX was assigned a score of 8 for profitability:
- NFLX's Return On Assets of 16.24% is amongst the best of the industry. NFLX outperforms 95.45% of its industry peers.
- NFLX's Return On Equity of 35.21% is amongst the best of the industry. NFLX outperforms 90.91% of its industry peers.
- NFLX has a Return On Invested Capital of 16.41%. This is amongst the best in the industry. NFLX outperforms 96.97% of its industry peers.
- The 3 year average ROIC (14.57%) for NFLX is below the current ROIC(16.41%), indicating increased profibility in the last year.
- The Profit Margin of NFLX (22.34%) is better than 93.94% of its industry peers.
- NFLX's Profit Margin has improved in the last couple of years.
- The Operating Margin of NFLX (26.71%) is better than 96.97% of its industry peers.
- NFLX's Operating Margin has improved in the last couple of years.
- In the last couple of years the Gross Margin of NFLX has grown nicely.
Our Affordable Growth screener lists more Affordable Growth stocks and is updated daily.
Our latest full fundamental report of NFLX contains the most current fundamental analsysis.
Disclaimer
This is not investing advice! The article highlights some of the observations at the time of writing, but you should always make your own analysis and invest based on your own insights.
973.03
+11.4 (+1.19%)
Find more stocks in the Stock Screener
NFLX Latest News and Analysis
 2 days ago - ChartmillFriday's after hours session: top gainers and losers in the S&P500 index
The regular session of the US market on Friday is now over, but let's get a preview of the after-hours session and explore the top S&P500 gainers and losers driving the post-market movements.
 3 days ago - ChartmillNetflix Surges After Delivering Robust Q1 Earnings, Raises Q2 Outlook
Netflix kicked off earnings season with impressive first-quarter results.
 3 days ago - ChartmillMarket Monitor April 18 ( Eli Lilly, Netflix UP, United Health Group, Manpower DOWN)
Wall Street Mostly Lower Amid Trump-Fed Tensions, Nvidia’s Continued Slide
 5 days ago - ChartmillMarket Monitor April 16 ( Netflix, Palantir UP, Nvidia, Applied Digital DOWN)
Calm Trading on Wall Street as Netflix Shines, Nvidia Stumbles after-hours
 5 days ago - ChartmillUncover the latest developments among S&P500 stocks in today's session.
Stay informed about the performance of the S&P500 index one hour before the close of the markets on Tuesday. Uncover the top gainers and losers in today's session for valuable insights.
5 days ago - ChartmillWhich S&P500 stocks are moving on Tuesday?Stay informed about the performance of the S&P500 index in the middle of the day on Tuesday. Uncover the top gainers and losers in today's session for valuable insights.
