
Is NYSE:KKR a Fit for high Growth Investing Strategies?
By Mill Chart
Last update: Nov 4, 2024
A possible breakout setup was detected on KKR & CO INC (NYSE:KKR) by our stockscreener. A breakout pattern is formed when a stock consolidates after a strong rise up. We note that this pattern is detected purely based on technical analysis and whether the breakout actually materializes remains to be seen. It could be interesting to keep an eye on NYSE:KKR.
Zooming in on the technicals.
At ChartMill, a crucial aspect of their analysis is the assignment of a Technical Rating to each stock. This rating, ranging from 0 to 10, is calculated daily by considering numerous technical indicators and properties.
Overall KKR gets a technical rating of 10 out of 10. Both in the recent history as in the last year, KKR has proven to be a steady performer, scoring decent points in every aspect analyzed.
- The long and short term trends are both positive. This is looking good!
- Looking at the yearly performance, KKR did better than 96% of all other stocks. We also observe that the gains produced by KKR over the past year are nicely spread over this period.
- KKR is one of the better performing stocks in the Capital Markets industry, it outperforms 98% of 218 stocks in the same industry.
- KKR is currently trading near its 52 week high, which is a good sign. The S&P500 Index however is also trading near new highs, which makes the performance in line with the market.
- In the last month KKR has a been trading in the 130.23 - 147.15 range, which is quite wide. It is currently trading in the middle of this range, so some resistance may be found above.
Check the latest full technical report of KKR for a complete technical analysis.
Why is NYSE:KKR a setup?
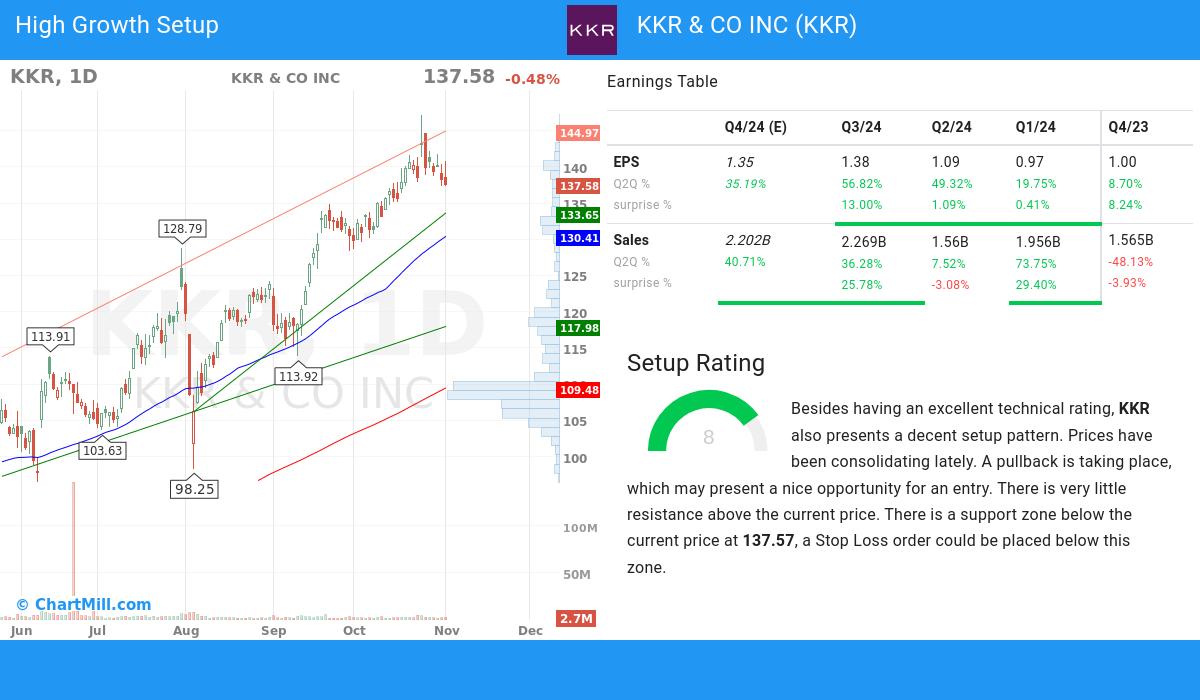
Besides the Technical Rating, ChartMill assigns a Setup Rating to every stock to determine the degree of consolidation. This rating, ranging from 0 to 10, is updated daily and evaluates various short-term technical indicators. NYSE:KKR currently holds a 8 as its setup rating, suggesting a particular level of consolidation in the stock.
Besides having an excellent technical rating, KKR also presents a decent setup pattern. Prices have been consolidating lately. A pullback is taking place, which may present a nice opportunity for an entry. There is very little resistance above the current price. There is a support zone below the current price at 137.57, a Stop Loss order could be placed below this zone.
Some of the high growth metrics of NYSE:KKR highlighted
- KKR & CO INC has shown positive momentum in its earnings per share (EPS) on a quarter-to-quarter (Q2Q) basis, with a 56.82% increase. This reflects the company's successful execution of its business strategies and its commitment to delivering improved financial results.
- KKR & CO INC has demonstrated strong quarter-to-quarter (Q2Q) revenue growth of 36.28%, reflecting its ability to generate consistent increases in sales. This growth highlights the company's effective market positioning and its potential for continued success.
- With notable 1-year revenue growth of 85.42%, KKR & CO INC exemplifies its ability to generate increased sales and revenue streams. This growth signifies the company's strong business performance and its potential for future growth.
- The recent financial report of KKR & CO INC demonstrates a 56.82% increase in quarterly earnings compared to the previous quarter. This growth indicates positive momentum in the company's financials and suggests a promising upward trend
- accelerating EPS growth for KKR & CO INC: the current Q2Q growth of 56.82% exceeds the previous year Q2Q growth of -4.35%.
- With positive growth in its free cash flow (FCF) over the past year, KKR & CO INC showcases its ability to generate strong cash flows and maintain a solid financial position. This growth reflects the company's efficient utilization of capital and its commitment to long-term value creation.
- KKR & CO INC demonstrates a strong Return on Equity(ROE) of 17.83%. This indicates the company's ability to generate favorable returns for shareholders and reflects its efficient utilization of capital. KKR & CO INC shows promising potential for continued success.
- With institutional shareholders at 6.69%, KKR & CO INC demonstrates a healthy ownership distribution. This reflects a mix of institutional and individual investors, creating a market environment that may foster increased trading activity and price discovery.
- KKR & CO INC has a strong history of beating EPS estimates in the last 4 quarters, signaling its ability to consistently exceed market expectations. This indicates the company's strong financial performance and its potential for creating shareholder value.
- The Relative Strength (RS) of KKR & CO INC has been consistently solid, with a current 96.16 rating. This highlights the stock's ability to exhibit sustained price strength and signifies its competitive advantage. KKR & CO INC exhibits strong prospects for further price appreciation.
More high growth momentum breakout stocks can be found in our High Growth Momentum Breakout screen.
Disclaimer
This is not investing advice! The article highlights some of the observations at the time of writing, but you should always make your own analysis and invest based on your own insights.
113.25
+6.44 (+6.03%)
Find more stocks in the Stock Screener
KKR Latest News and Analysis
 2 days ago - ChartmillWhich S&P500 stocks are gapping on Wednesday?
Curious about the S&P500 stocks that are gapping on Wednesday? Explore the gap up and gap down stocks in the S&P500 index during today's session.
14 days ago - ChartmillWhich S&P500 stocks are gapping on Friday?Curious about the S&P500 stocks that are gapping on Friday? Explore the gap up and gap down stocks in the S&P500 index during today's session.
 15 days ago - ChartmillThese S&P500 stocks are moving in today's pre-market session
As the US market prepares to open on Thursday, let's get an early glimpse into the pre-market session and identify the S&P500 stocks leading the pack in terms of gains and losses.
 17 days ago - ChartmillWhich S&P500 stocks are moving on Monday?
Wondering what's happening in today's session for the S&P500 index? Stay informed with the top movers within the S&P500 index on Monday.
18 days ago - ChartmillWhat's going on in today's session: S&P500 moversLet's delve into the developments on the US markets in the middle of the day on Monday. Below, you'll find the top gainers and losers within the S&P500 index during today's session.
