
Why NYSE:KKR qualifies as a high growth stock.
By Mill Chart
Last update: Oct 11, 2024
Our stock screener has identified KKR & CO INC (NYSE:KKR) as a potential breakout candidate. This technical breakout setup pattern occurs when the stock consolidates after a strong uptrend. While the actual breakout is uncertain, it may be worth keeping an eye on NYSE:KKR.
Technical analysis of NYSE:KKR
ChartMill assigns a Technical Rating to every stock. This score, ranging from 0 to 10, is updated daily and is determined by evaluating multiple technical indicators and properties.
We assign a technical rating of 10 out of 10 to KKR. This is due to a consistent performance in both the short and longer term time frames. Also compared to the overall market, KKR is showing a nice and steady performance.
- Both the short term and long term trends are positive. This is a very positive sign.
- Looking at the yearly performance, KKR did better than 96% of all other stocks. On top of that, KKR also shows a nice and consistent pattern of rising prices.
- KKR is one of the better performing stocks in the Capital Markets industry, it outperforms 98% of 221 stocks in the same industry.
- A new 52 week high is currently being made by KKR, which is a very good signal! However, this is in line with the S&P500, which is also trading near new highs.
- In the last month KKR has a been trading in the 120.96 - 135.25 range, which is quite wide. It is currently trading near the high of this range.
- Prices have been consolidating recently, this may present a good entry opportunity.
Check the latest full technical report of KKR for a complete technical analysis.
How do we evaluate the setup for NYSE:KKR?
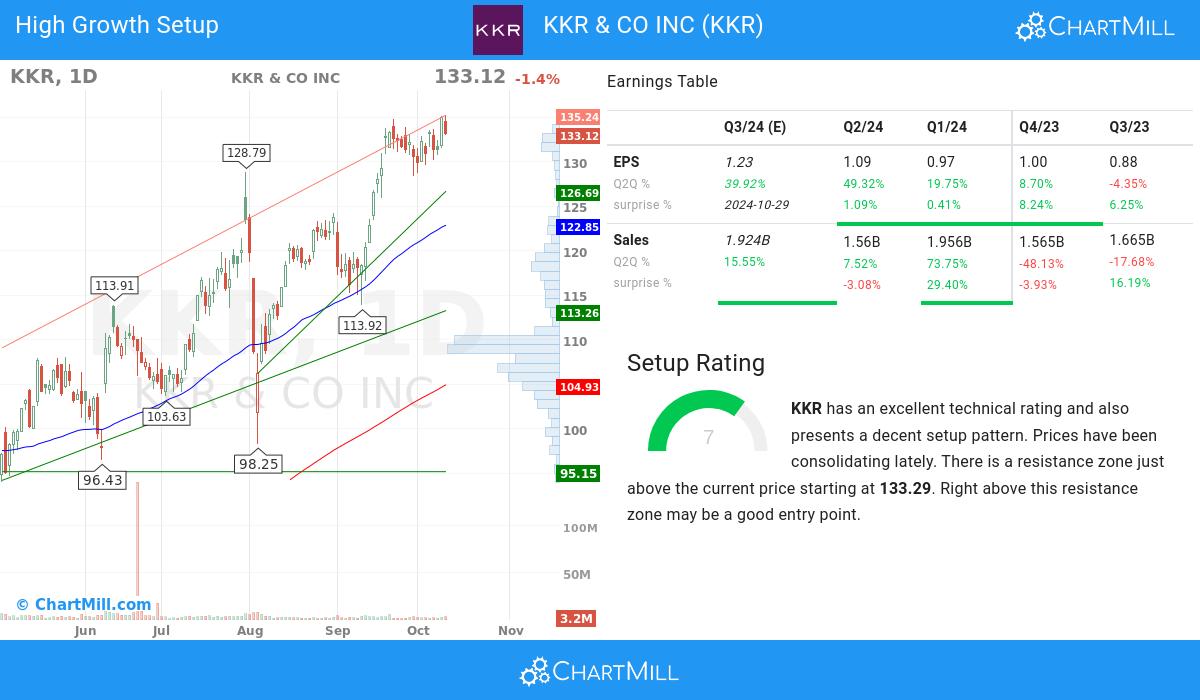
Alongside the Technical Rating, ChartMill assigns a Setup Rating to evaluate the consolidation level of a stock. This rating, ranging from 0 to 10, is updated daily and considers various short-term technical indicators. The current setup rating for NYSE:KKR is 7:
KKR has an excellent technical rating and also presents a decent setup pattern. Prices have been consolidating lately. There is a resistance zone just above the current price starting at 133.29. Right above this resistance zone may be a good entry point.
Looking into the high growth metrics of KKR & CO INC
- The EPS of KKR & CO INC has exhibited growth from one quarter to another (Q2Q), with a 49.32% increase. This underscores the company's ability to generate higher earnings and improve its financial standing.
- The 1-year revenue growth of KKR & CO INC (83.72%) has been strong, reflecting the company's ability to generate consistent sales growth. This growth suggests the company's ability to meet customer needs and expand its market share.
- The recent financial report of KKR & CO INC demonstrates a 49.32% increase in quarterly earnings compared to the previous quarter. This growth indicates positive momentum in the company's financials and suggests a promising upward trend
- KKR & CO INC shows accelerating EPS growth: when comparing the current Q2Q growth of 49.32% to the previous year Q2Q growth of -23.16%, we see the growth rate improving.
- The free cash flow (FCF) of KKR & CO INC has seen steady growth over the past year, indicating enhanced cash flow generation and financial health. This trend underscores the company's effective capital management and its ability to generate sustainable cash flows.
- KKR & CO INC has a healthy Return on Equity(ROE) of 17.83%. This demonstrates the company's efficient utilization of capital and indicates its commitment to driving profitability.
- With institutional shareholders at 60.96%, KKR & CO INC demonstrates a healthy ownership distribution. This reflects a mix of institutional and individual investors, creating a market environment that may foster increased trading activity and price discovery.
- KKR & CO INC has consistently surpassed EPS estimates in the last 4 quarters, reflecting its strong financial performance and effective management. This trend suggests the company's ability to generate positive earnings surprises and drive shareholder value.
- KKR & CO INC has maintained a healthy Relative Strength (RS) over the analyzed period, with a current 96.44 rating. This demonstrates the stock's ability to outperform its peers and indicates its competitive positioning. KKR & CO INC is well-positioned for potential price growth opportunities.
Our High Growth Momentum Breakout screen will find you more ideas suited for high growth momentum breakouts.
Keep in mind
Important Note: The content of this article is not intended as trading advice. It is essential to perform your own analysis and exercise caution when making trading decisions. The article presents observations created by automated analysis but does not guarantee any trading or investment outcomes. Always trade responsibly and make independent judgments.
103.37
+1.32 (+1.29%)
Find more stocks in the Stock Screener
KKR Latest News and Analysis
 8 days ago - ChartmillWhich S&P500 stocks are gapping on Friday?
Curious about the S&P500 stocks that are gapping on Friday? Explore the gap up and gap down stocks in the S&P500 index during today's session.
 10 days ago - ChartmillThese S&P500 stocks are moving in today's pre-market session
As the US market prepares to open on Thursday, let's get an early glimpse into the pre-market session and identify the S&P500 stocks leading the pack in terms of gains and losses.
 12 days ago - ChartmillWhich S&P500 stocks are moving on Monday?
Wondering what's happening in today's session for the S&P500 index? Stay informed with the top movers within the S&P500 index on Monday.
12 days ago - ChartmillWhat's going on in today's session: S&P500 moversLet's delve into the developments on the US markets in the middle of the day on Monday. Below, you'll find the top gainers and losers within the S&P500 index during today's session.
16 days ago - ChartmillGapping S&P500 stocks in Thursday's sessionWondering which stocks are making significant price gaps? Explore the S&P500 index on Thursday to find the gap up and gap down stocks in today's session.
