While growth is established for NASDAQ:HRMY, the stock's valuation remains reasonable.
By Mill Chart
Last update: Feb 18, 2025
HARMONY BIOSCIENCES HOLDINGS (NASDAQ:HRMY) has caught the eye of our stock screener as an affordable growth stock. NASDAQ:HRMY is displaying robust growth metrics and also excels in terms of profitability, solvency, and liquidity. Additionally, it appears to be reasonably priced. Let's delve into the details.
Assessing Growth Metrics for NASDAQ:HRMY
ChartMill assigns a proprietary Growth Rating to each stock. The score is computed by evaluating various growth aspects, like EPS and revenue growth. We take into account the history as well as the estimated future numbers. NASDAQ:HRMY was assigned a score of 7 for growth:
- The Revenue has grown by 25.83% in the past year. This is a very strong growth!
- HRMY shows a strong growth in Revenue. Measured over the last years, the Revenue has been growing by 53.89% yearly.
- The Earnings Per Share is expected to grow by 37.92% on average over the next years. This is a very strong growth
- The Revenue is expected to grow by 24.18% on average over the next years. This is a very strong growth
A Closer Look at Valuation for NASDAQ:HRMY
ChartMill assigns a Valuation Rating to every stock. This score ranges from 0 to 10 and evaluates the different valuation aspects and compares the price to earnings and cash flows, while taking into account profitability and growth. NASDAQ:HRMY scores a 7 out of 10:
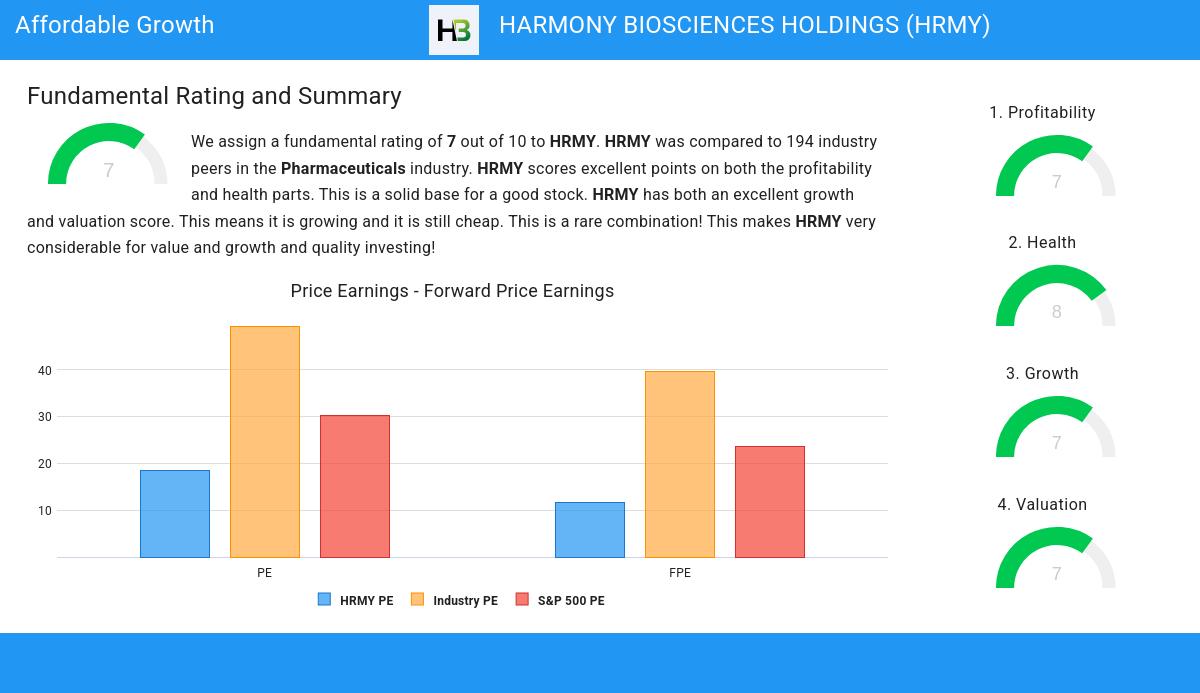
- Compared to the rest of the industry, the Price/Earnings ratio of HRMY indicates a rather cheap valuation: HRMY is cheaper than 85.41% of the companies listed in the same industry.
- Compared to an average S&P500 Price/Earnings ratio of 30.19, HRMY is valued a bit cheaper.
- Based on the Price/Forward Earnings ratio of 11.54, the valuation of HRMY can be described as reasonable.
- HRMY's Price/Forward Earnings ratio is rather cheap when compared to the industry. HRMY is cheaper than 87.03% of the companies in the same industry.
- Compared to an average S&P500 Price/Forward Earnings ratio of 23.58, HRMY is valued rather cheaply.
- HRMY's Enterprise Value to EBITDA ratio is rather cheap when compared to the industry. HRMY is cheaper than 87.03% of the companies in the same industry.
- Based on the Price/Free Cash Flow ratio, HRMY is valued cheaper than 91.35% of the companies in the same industry.
- HRMY has a very decent profitability rating, which may justify a higher PE ratio.
- A more expensive valuation may be justified as HRMY's earnings are expected to grow with 23.60% in the coming years.
A Closer Look at Health for NASDAQ:HRMY
ChartMill assigns a Health Rating to every stock. This score ranges from 0 to 10 and evaluates the different health aspects like liquidity and solvency, both absolutely, but also relative to the industry peers. NASDAQ:HRMY scores a 8 out of 10:
- An Altman-Z score of 5.84 indicates that HRMY is not in any danger for bankruptcy at the moment.
- HRMY's Altman-Z score of 5.84 is amongst the best of the industry. HRMY outperforms 81.62% of its industry peers.
- The Debt to FCF ratio of HRMY is 0.83, which is an excellent value as it means it would take HRMY, only 0.83 years of fcf income to pay off all of its debts.
- Looking at the Debt to FCF ratio, with a value of 0.83, HRMY belongs to the top of the industry, outperforming 95.68% of the companies in the same industry.
- A Debt/Equity ratio of 0.28 indicates that HRMY is not too dependend on debt financing.
- A Current Ratio of 3.24 indicates that HRMY has no problem at all paying its short term obligations.
- HRMY has a Quick Ratio of 3.20. This indicates that HRMY is financially healthy and has no problem in meeting its short term obligations.
Evaluating Profitability: NASDAQ:HRMY
ChartMill utilizes a Profitability Rating to assess stocks, scoring them on a scale of 0 to 10. This rating takes into account a variety of profitability ratios and margins, both in absolute terms and in comparison to industry peers. NASDAQ:HRMY has earned a 7 out of 10:
- HRMY's Return On Assets of 13.21% is amongst the best of the industry. HRMY outperforms 96.76% of its industry peers.
- HRMY has a better Return On Equity (20.55%) than 93.51% of its industry peers.
- HRMY has a better Return On Invested Capital (18.64%) than 94.59% of its industry peers.
- The last Return On Invested Capital (18.64%) for HRMY is above the 3 year average (18.06%), which is a sign of increasing profitability.
- HRMY's Profit Margin of 17.98% is amongst the best of the industry. HRMY outperforms 90.81% of its industry peers.
- HRMY has a better Operating Margin (28.21%) than 92.43% of its industry peers.
- In the last couple of years the Operating Margin of HRMY has grown nicely.
- HRMY's Gross Margin of 78.65% is amongst the best of the industry. HRMY outperforms 83.24% of its industry peers.
Every day, new Affordable Growth stocks can be found on ChartMill in our Affordable Growth screener.
Our latest full fundamental report of HRMY contains the most current fundamental analsysis.
Disclaimer
Important Note: The content of this article is not intended as trading advice. It is essential to perform your own analysis and exercise caution when making trading decisions. The article presents observations created by automated analysis but does not guarantee any trading or investment outcomes. Always trade responsibly and make independent judgments.
35.32
-3.77 (-9.64%)
Find more stocks in the Stock Screener
HRMY Latest News and Analysis
 2 days ago - ChartmillWhile growth is established for NASDAQ:HRMY, the stock's valuation remains reasonable.
HARMONY BIOSCIENCES HOLDINGS could be undervalued. NASDAQ:HRMY is scoring impressively in terms of growth while demonstrating strong financials. On top of that, it remains attractively priced.
