Is FORTINET INC (NASDAQ:FTNT) on the Verge of a Major Breakout as a Strong Growth Stock?
By Mill Chart
Last update: Apr 24, 2025
In this article, we'll take a closer look at FORTINET INC (NASDAQ:FTNT) as a potential candidate for growth investing. While it's important for investors to conduct their own research, FORTINET INC has piqued our interest by appearing on our strong growth and breakout radar. Let's explore further.
Growth Insights: FTNT
Every stock receives a Growth Rating from ChartMill, ranging from 0 to 10. This rating assesses various growth aspects, including historical and projected EPS and revenue growth. FTNT boasts a 8 out of 10:
- The Earnings Per Share has grown by an impressive 44.51% over the past year.
- FTNT shows a strong growth in Earnings Per Share. Measured over the last years, the EPS has been growing by 36.84% yearly.
- The Revenue has grown by 12.27% in the past year. This is quite good.
- The Revenue has been growing by 22.46% on average over the past years. This is a very strong growth!
- The Earnings Per Share is expected to grow by 9.09% on average over the next years. This is quite good.
- The Revenue is expected to grow by 13.70% on average over the next years. This is quite good.
Assessing Health Metrics for FTNT
To gauge a stock's financial health, ChartMill utilizes a Health Rating on a scale of 0 to 10. This comprehensive evaluation encompasses liquidity and solvency, both in absolute terms and in comparison to industry peers. FTNT has earned a 8 out of 10:
- FTNT has an Altman-Z score of 6.85. This indicates that FTNT is financially healthy and has little risk of bankruptcy at the moment.
- With a decent Altman-Z score value of 6.85, FTNT is doing good in the industry, outperforming 77.19% of the companies in the same industry.
- The Debt to FCF ratio of FTNT is 0.53, which is an excellent value as it means it would take FTNT, only 0.53 years of fcf income to pay off all of its debts.
- The Debt to FCF ratio of FTNT (0.53) is better than 76.84% of its industry peers.
- Although FTNT does not score too well on debt/equity it has very limited outstanding debt, which is well covered by the FCF. We will not put too much weight on the debt/equity number as it may be because of low equity, which could be a consequence of a share buyback program for instance. This needs to be investigated.
- The current and quick ratio evaluation for FTNT is rather negative, while it does have excellent solvency and profitability. These ratios do not necessarly indicate liquidity issues and need to be evaluated against the specifics of the business.
Profitability Analysis for FTNT
Discover ChartMill's exclusive Profitability Rating, a proprietary metric that assesses stocks on a scale of 0 to 10. It takes into consideration various profitability ratios and margins, both in absolute terms and relative to industry peers. Notably, FTNT has achieved a 9:
- With an excellent Return On Assets value of 17.88%, FTNT belongs to the best of the industry, outperforming 94.74% of the companies in the same industry.
- With an excellent Return On Equity value of 116.83%, FTNT belongs to the best of the industry, outperforming 98.95% of the companies in the same industry.
- FTNT has a Return On Invested Capital of 27.67%. This is amongst the best in the industry. FTNT outperforms 96.84% of its industry peers.
- Measured over the past 3 years, the Average Return On Invested Capital for FTNT is significantly above the industry average of 11.46%.
- FTNT has a better Profit Margin (29.30%) than 92.28% of its industry peers.
- In the last couple of years the Profit Margin of FTNT has grown nicely.
- FTNT's Operating Margin of 30.20% is amongst the best of the industry. FTNT outperforms 94.74% of its industry peers.
- In the last couple of years the Operating Margin of FTNT has grown nicely.
- With an excellent Gross Margin value of 80.56%, FTNT belongs to the best of the industry, outperforming 82.81% of the companies in the same industry.
Why is FTNT a setup?
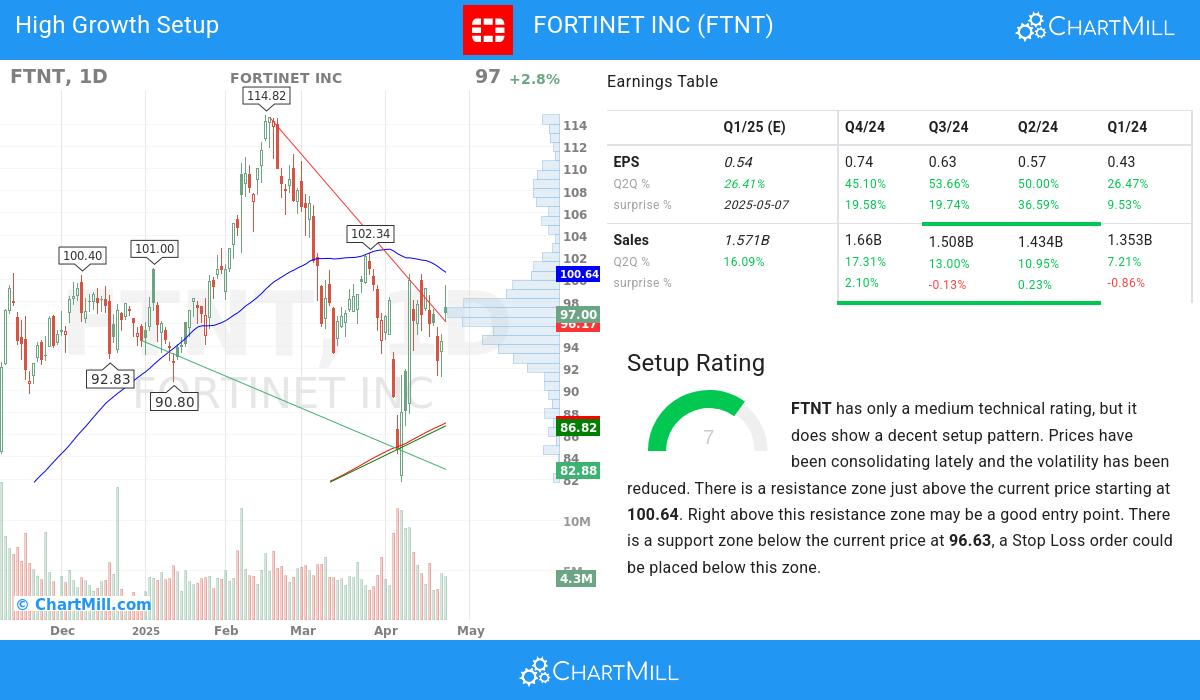
The Setup Rating of a stock determines to which extend the stock is consolidating. This score also ranges from 0 to 10 and is updated daily. The setup score evaluates various short term technical indicators. For FTNT this score is currently 7:
FTNT has only a medium technical rating, but it does show a decent setup pattern. We see reduced volatility while prices have been consolidating in the most recent period. There is a resistance zone just above the current price starting at 100.64. Right above this resistance zone may be a good entry point. There is a support zone below the current price at 96.63, a Stop Loss order could be placed below this zone.
More Strong Growth stocks can be found in our Strong Growth screener.
Check the latest full fundamental report of FTNT for a complete fundamental analysis.
For an up to date full technical analysis you can check the technical report of FTNT
Disclaimer
This is not investing advice! The article highlights some of the observations at the time of writing, but you should always make your own analysis and invest based on your own insights.
97
+2.63 (+2.79%)
Find more stocks in the Stock Screener
FTNT Latest News and Analysis
 a few seconds ago - ChartmillIs FORTINET INC (NASDAQ:FTNT) on the Verge of a Major Breakout as a Strong Growth Stock?
Based on a technical and fundamental analysis of NASDAQ:FTNT we ask: Why FORTINET INC (NASDAQ:FTNT) Is a Promising High-Growth Stock in the Midst of Consolidation.
