Why EXELIXIS INC (NASDAQ:EXEL) is Poised for High Growth.
By Mill Chart
Last update: Apr 16, 2025
Our stock screener has flagged EXELIXIS INC (NASDAQ:EXEL) as a potential breakout candidate. This occurs when the stock shows signs of consolidation after a notable upward trend. While we can't predict the actual breakout, it's worth monitoring NASDAQ:EXEL for potential movement.
Analyzing the Technical Aspects
Every day ChartMill assigns a Technical Rating to every stock. The score ranges from 0 to 10 and is determined by evaluating multiple technical indicators and properties.
We assign a technical rating of 9 out of 10 to EXEL. This is due to a consistent performance in both the short and longer term time frames. Also compared to the overall market, EXEL is showing a nice and steady performance.
- The long term trend is positive and the short term trend is neutral. The long term trend gets the benefit of the doubt for now.
- When comparing the yearly performance of all stocks, we notice that EXEL is one of the better performing stocks in the market, outperforming 94% of all stocks. On top of that, EXEL also shows a nice and consistent pattern of rising prices.
- EXEL is part of the Biotechnology industry. There are 568 other stocks in this industry. EXEL outperforms 92% of them.
- EXEL is currently trading in the upper part of its 52 week range. The market is still in the middle of its 52 week range, so EXEL slightly outperforms the market at the moment.
- In the last month EXEL has a been trading in the 32.38 - 38.41 range, which is quite wide. It is currently trading in the middle of this range, so some resistance may be found above.
Our latest full technical report of EXEL contains the most current technical analsysis.
How does the Setup look for EXEL
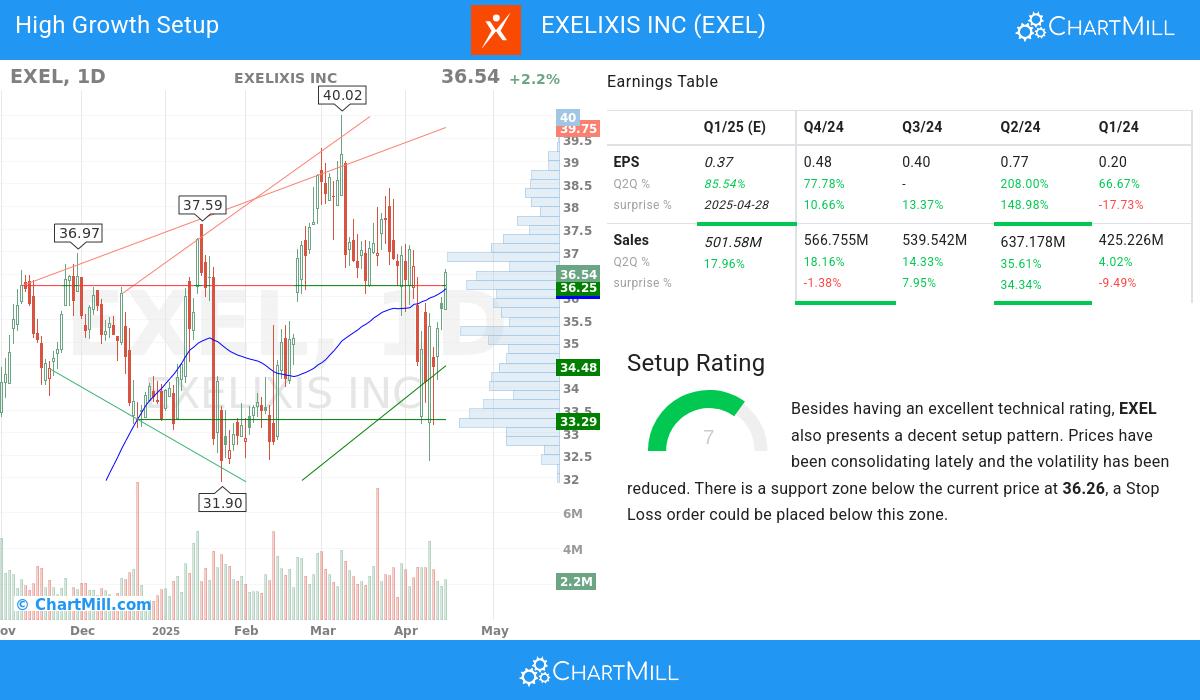
ChartMill also assign a Setup Rating to every stock. With this score it is determined to what extend the stock has been trading in a range in the recent days and weeks. This score also ranges from 0 to 10 and is updated daily. The setup score evaluates various short term technical indicators. EXEL scores a 7 out of 10:
Besides having an excellent technical rating, EXEL also presents a decent setup pattern. We see reduced volatility while prices have been consolidating in the most recent period. There is a support zone below the current price at 36.26, a Stop Loss order could be placed below this zone.
Unpacking EXEL's High Growth Momentum Rating
To evaluate a stock's growth potential, ChartMill utilizes a High Growth Momentum Rating (HGM) on a scale of 0 to 10. This assessment considers various growth and profitability aspects, like EPS and revenue growth, accelleration, surprises and revisions. EXEL has achieved a 6 out of 10:
Earnings Momentum
- The recent financial report of EXEL demonstrates a 77.78% increase in quarterly earnings compared to the previous quarter. This growth indicates positive momentum in the company's financials and suggests a promising upward trend
- EXEL has achieved 189.0% growth in EPS over the past 12 months, reflecting a sustained improvement in earnings performance.
- Over the past 3 years, EXEL has demonstrated 37.61% growth in EPS, signifying its positive financial trajectory and potential for future profitability.
- EXEL has demonstrated strong q2q revenue growth of 18.16%, suggesting a favorable trend in the company's financials and indicating the potential for continued expansion.
- The sales growth of EXEL is accelerating: the current Q2Q growth of 18.16% is above the previous quarter Q2Q growth of 14.33%. Sales momentum and acceleration are key for high growth systems.
- EXEL has a strong history of beating EPS estimates 3 times in the last 4 quarters, signaling its ability to consistently exceed market expectations. This indicates the company's strong financial performance and its potential for creating shareholder value.
Financial Strength & Profitability
- The operating margin of EXEL has seen steady growth over the past year, signaling improved profitability. This trend indicates the company's effective cost management and its ability to generate higher returns.
- With positive growth in its profit margin over the past year, EXEL showcases its ability to improve profitability.
- With positive growth in its free cash flow (FCF) over the past year, EXEL showcases its ability to generate strong cash flows and maintain a solid financial position. This growth reflects the company's efficient utilization of capital and its commitment to long-term value creation.
- With a solid Return on Equity (ROE) of 23.23%, EXEL exemplifies its ability to generate favorable returns on shareholder investments. This metric demonstrates the company's commitment to maximizing shareholder value.
- A Debt/Equity ratio of 0.0 highlights EXEL's commitment to maintaining financial stability.
Market Strength & Institutional Confidence
- With institutional shareholders at 91.92%, EXEL demonstrates a healthy ownership distribution. This reflects a mix of institutional and individual investors, creating a market environment that may foster increased trading activity and price discovery.
- The Relative Strength (RS) of EXEL has consistently been strong, with a current 94.74 rating. This indicates the stock's ability to exhibit relative price outperformance and reflects its competitive strength.
More high growth momentum breakout stocks can be found in our High Growth Momentum Breakout screen.
Disclaimer
This article should in no way be interpreted as advice. The article is based on the observed metrics at the time of writing, but you should always make your own analysis and trade or invest at your own responsibility.
36.19
+0.04 (+0.11%)
Find more stocks in the Stock Screener
EXEL Latest News and Analysis
 2 days ago - ChartmillWhy EXELIXIS INC (NASDAQ:EXEL) is Poised for High Growth.
Exploring high growth characteristics of EXELIXIS INC (NASDAQ:EXEL). A fundamental and technical analysis of (NASDAQ:EXEL).
 4 days ago - ChartmillEXELIXIS INC (NASDAQ:EXEL) qualifies as a high growth stock and is consolidating.
Based on a technical and fundamental analysis of NASDAQ:EXEL we can say: EXELIXIS INC (NASDAQ:EXEL), a strong growth stock, setting up for a breakout.
 13 days ago - ChartmillFor those who appreciate growth without the sticker shock, EXELIXIS INC (NASDAQ:EXEL) is worth considering.
EXELIXIS INC was identified as a growth stock that isn't overvalued. NASDAQ:EXEL is excelling in various growth indicators while maintaining a solid financial footing.
 15 days ago - ChartmillEXELIXIS INC (NASDAQ:EXEL) stands out as a stock that provides good value for the fundamentals it showcases.
EXELIXIS INC is a hidden gem, featuring undervaluation and robust fundamentals. NASDAQ:EXEL showcases decent financial health and profitability, coupled with an attractive price.
