
EXELIXIS INC (NASDAQ:EXEL) stands out as a stock that provides good value for the fundamentals it showcases.
By Mill Chart
Last update: Apr 3, 2025
Discover EXELIXIS INC (NASDAQ:EXEL)—an undervalued stock our stock screener has picked out. EXEL demonstrates solid fundamentals, including health and profitability, all while staying attractively priced. Let's explore the details.
Unpacking EXEL's Valuation Rating
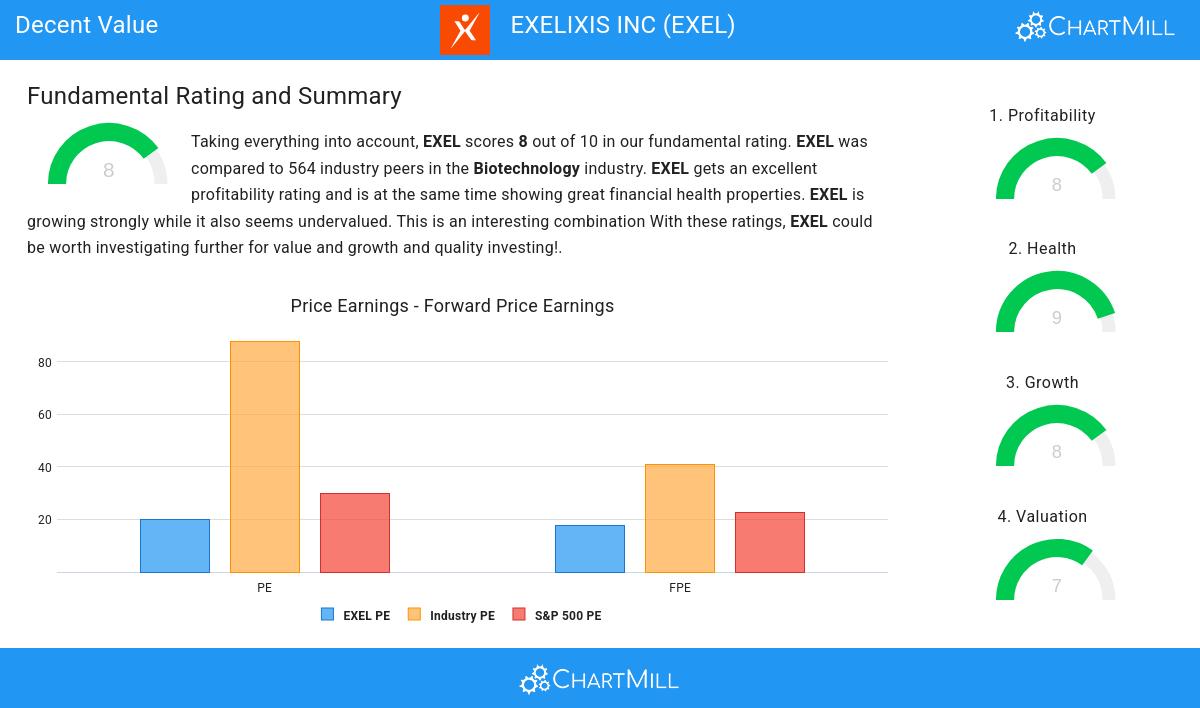
ChartMill assigns a Valuation Rating to each stock, ranging from 0 to 10. This rating is calculated by analyzing different valuation elements, such as price to earnings and free cash flow, both in absolute terms and relative to the market and industry. In the case of EXEL, the assigned 7 reflects its valuation:
- Based on the Price/Earnings ratio, EXEL is valued cheaper than 96.45% of the companies in the same industry.
- EXEL's Price/Earnings ratio indicates a valuation a bit cheaper than the S&P500 average which is at 29.85.
- EXEL's Price/Forward Earnings ratio is rather cheap when compared to the industry. EXEL is cheaper than 94.68% of the companies in the same industry.
- EXEL's Price/Forward Earnings ratio indicates a valuation a bit cheaper than the S&P500 average which is at 22.57.
- EXEL's Enterprise Value to EBITDA ratio is rather cheap when compared to the industry. EXEL is cheaper than 96.45% of the companies in the same industry.
- Compared to the rest of the industry, the Price/Free Cash Flow ratio of EXEL indicates a rather cheap valuation: EXEL is cheaper than 96.81% of the companies listed in the same industry.
- EXEL has an outstanding profitability rating, which may justify a higher PE ratio.
- A more expensive valuation may be justified as EXEL's earnings are expected to grow with 20.67% in the coming years.
Assessing Profitability for EXEL
ChartMill's Profitability Rating offers a unique perspective on stock analysis, providing scores from 0 to 10. These ratings consider a wide range of profitability metrics and margins, both in comparison to industry peers and on their own merits. For EXEL, the assigned 8 is a significant indicator of profitability:
- The Return On Assets of EXEL (17.68%) is better than 97.87% of its industry peers.
- With an excellent Return On Equity value of 23.23%, EXEL belongs to the best of the industry, outperforming 97.87% of the companies in the same industry.
- EXEL has a better Return On Invested Capital (21.31%) than 98.58% of its industry peers.
- The last Return On Invested Capital (21.31%) for EXEL is above the 3 year average (10.78%), which is a sign of increasing profitability.
- EXEL has a better Profit Margin (24.04%) than 97.34% of its industry peers.
- EXEL has a better Operating Margin (31.81%) than 98.40% of its industry peers.
- The Gross Margin of EXEL (96.49%) is better than 95.39% of its industry peers.
Unpacking EXEL's Health Rating
ChartMill assigns a proprietary Health Rating to each stock. The score is computed by evaluating various liquidity and solvency ratios and ranges from 0 to 10. EXEL was assigned a score of 9 for health:
- An Altman-Z score of 10.74 indicates that EXEL is not in any danger for bankruptcy at the moment.
- Looking at the Altman-Z score, with a value of 10.74, EXEL belongs to the top of the industry, outperforming 89.18% of the companies in the same industry.
- There is no outstanding debt for EXEL. This means it has a Debt/Equity and Debt/FCF ratio of 0 and it is amongst the best of the sector and industry.
- EXEL has a Current Ratio of 3.63. This indicates that EXEL is financially healthy and has no problem in meeting its short term obligations.
- EXEL has a Quick Ratio of 3.58. This indicates that EXEL is financially healthy and has no problem in meeting its short term obligations.
Deciphering EXEL's Growth Rating
ChartMill assigns a Growth Rating to each stock, ranging from 0 to 10. This rating is determined by analyzing different growth elements, including EPS and revenue growth, spanning both historical and future figures. In the case of EXEL, the assigned 8 reflects its growth potential:
- The Earnings Per Share has grown by an impressive 189.06% over the past year.
- The Earnings Per Share has been growing by 12.65% on average over the past years. This is quite good.
- EXEL shows quite a strong growth in Revenue. In the last year, the Revenue has grown by 18.50%.
- The Revenue has been growing by 17.51% on average over the past years. This is quite good.
- EXEL is expected to show a strong growth in Earnings Per Share. In the coming years, the EPS will grow by 24.81% yearly.
- EXEL is expected to show quite a strong growth in Revenue. In the coming years, the Revenue will grow by 10.38% yearly.
- When comparing the EPS growth rate of the last years to the growth rate of the upcoming years, we see that the growth is accelerating.
Our Decent Value screener lists more Decent Value stocks and is updated daily.
Check the latest full fundamental report of EXEL for a complete fundamental analysis.
Keep in mind
Important Note: The content of this article is not intended as trading advice. It is essential to perform your own analysis and exercise caution when making trading decisions. The article presents observations created by automated analysis but does not guarantee any trading or investment outcomes. Always trade responsibly and make independent judgments.
NASDAQ:EXEL (4/24/2025, 12:35:59 PM)
37.34
+0.56 (+1.52%)
Find more stocks in the Stock Screener
EXEL Latest News and Analysis
 8 days ago - ChartmillWhy EXELIXIS INC (NASDAQ:EXEL) is Poised for High Growth.
Exploring high growth characteristics of EXELIXIS INC (NASDAQ:EXEL). A fundamental and technical analysis of (NASDAQ:EXEL).
 10 days ago - ChartmillEXELIXIS INC (NASDAQ:EXEL) qualifies as a high growth stock and is consolidating.
Based on a technical and fundamental analysis of NASDAQ:EXEL we can say: EXELIXIS INC (NASDAQ:EXEL), a strong growth stock, setting up for a breakout.
 19 days ago - ChartmillFor those who appreciate growth without the sticker shock, EXELIXIS INC (NASDAQ:EXEL) is worth considering.
EXELIXIS INC was identified as a growth stock that isn't overvalued. NASDAQ:EXEL is excelling in various growth indicators while maintaining a solid financial footing.
