Investors should take note of NASDAQ:EXEL, a growth stock that remains attractively priced.
By Mill Chart
Last update: Jan 27, 2025
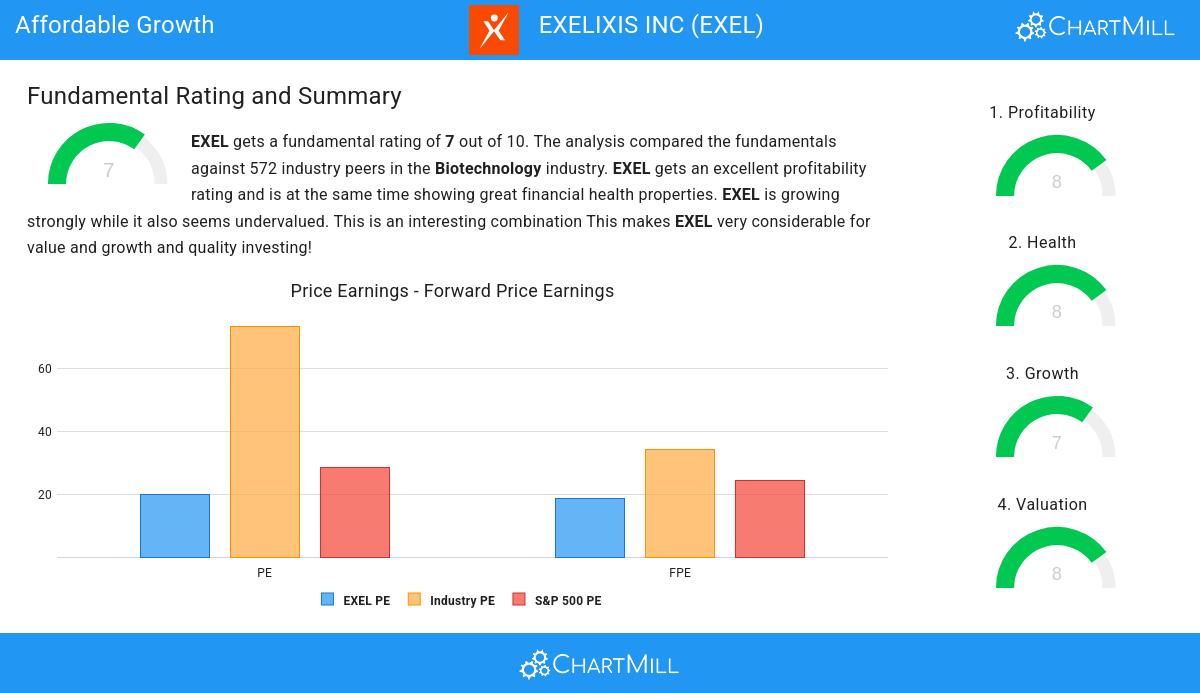
Uncover the potential of EXELIXIS INC (NASDAQ:EXEL), a growth stock that our stock screener found to be reasonably priced. NASDAQ:EXEL is excelling in growth aspects, maintaining a healthy financial position, and still offers an attractive valuation. We'll examine each aspect in detail.
Growth Assessment of NASDAQ:EXEL
ChartMill employs its own Growth Rating system for all stocks. This score, ranging from 0 to 10, is derived by evaluating different growth factors, such as EPS and revenue growth, taking into account both past performance and future projections. NASDAQ:EXEL has earned a 7 for growth:
- EXEL shows a strong growth in Earnings Per Share. In the last year, the EPS has been growing by 485.71%, which is quite impressive.
- Looking at the last year, EXEL shows a quite strong growth in Revenue. The Revenue has grown by 17.31% in the last year.
- Measured over the past years, EXEL shows a quite strong growth in Revenue. The Revenue has been growing by 16.47% on average per year.
- Based on estimates for the next years, EXEL will show a very strong growth in Earnings Per Share. The EPS will grow by 43.78% on average per year.
- The Revenue is expected to grow by 11.43% on average over the next years. This is quite good.
- When comparing the EPS growth rate of the last years to the growth rate of the upcoming years, we see that the growth is accelerating.
A Closer Look at Valuation for NASDAQ:EXEL
ChartMill assigns a proprietary Valuation Rating to each stock. The score is computed by evaluating various valuation aspects, like price to earnings and free cash flow, both absolutely as relative to the market and industry. NASDAQ:EXEL was assigned a score of 8 for valuation:
- 95.75% of the companies in the same industry are more expensive than EXEL, based on the Price/Earnings ratio.
- EXEL's Price/Earnings ratio indicates a valuation a bit cheaper than the S&P500 average which is at 28.58.
- Based on the Price/Forward Earnings ratio, EXEL is valued cheaper than 95.04% of the companies in the same industry.
- EXEL is valuated rather cheaply when we compare the Price/Forward Earnings ratio to 24.47, which is the current average of the S&P500 Index.
- Compared to the rest of the industry, the Enterprise Value to EBITDA ratio of EXEL indicates a rather cheap valuation: EXEL is cheaper than 97.17% of the companies listed in the same industry.
- Based on the Price/Free Cash Flow ratio, EXEL is valued cheaply inside the industry as 96.46% of the companies are valued more expensively.
- The low PEG Ratio(NY), which compensates the Price/Earnings for growth, indicates a rather cheap valuation of the company.
- EXEL has an outstanding profitability rating, which may justify a higher PE ratio.
- A more expensive valuation may be justified as EXEL's earnings are expected to grow with 52.33% in the coming years.
How do we evaluate the Health for NASDAQ:EXEL?
ChartMill assigns a Health Rating to every stock. This score ranges from 0 to 10 and evaluates the different health aspects like liquidity and solvency, both absolutely, but also relative to the industry peers. NASDAQ:EXEL scores a 8 out of 10:
- EXEL has an Altman-Z score of 9.91. This indicates that EXEL is financially healthy and has little risk of bankruptcy at the moment.
- The Altman-Z score of EXEL (9.91) is better than 86.02% of its industry peers.
- EXEL has no outstanding debt. Therefor its Debt/Equity and Debt/FCF ratios are 0 and belong to the best of the industry.
- A Current Ratio of 3.93 indicates that EXEL has no problem at all paying its short term obligations.
- EXEL has a Quick Ratio of 3.88. This indicates that EXEL is financially healthy and has no problem in meeting its short term obligations.
Evaluating Profitability: NASDAQ:EXEL
ChartMill utilizes a Profitability Rating to assess stocks, scoring them on a scale of 0 to 10. This rating takes into account a variety of profitability ratios and margins, both in absolute terms and in comparison to industry peers. NASDAQ:EXEL has earned a 8 out of 10:
- The Return On Assets of EXEL (15.77%) is better than 98.05% of its industry peers.
- EXEL's Return On Equity of 20.52% is amongst the best of the industry. EXEL outperforms 97.17% of its industry peers.
- EXEL has a Return On Invested Capital of 18.78%. This is amongst the best in the industry. EXEL outperforms 97.70% of its industry peers.
- The 3 year average ROIC (7.03%) for EXEL is below the current ROIC(18.78%), indicating increased profibility in the last year.
- EXEL has a better Profit Margin (22.43%) than 97.35% of its industry peers.
- EXEL's Operating Margin of 29.22% is amongst the best of the industry. EXEL outperforms 98.41% of its industry peers.
- EXEL has a Gross Margin of 96.25%. This is amongst the best in the industry. EXEL outperforms 96.64% of its industry peers.
Every day, new Affordable Growth stocks can be found on ChartMill in our Affordable Growth screener.
Check the latest full fundamental report of EXEL for a complete fundamental analysis.
Keep in mind
This article should in no way be interpreted as advice. The article is based on the observed metrics at the time of writing, but you should always make your own analysis and trade or invest at your own responsibility.
36.19
+0.04 (+0.11%)
Find more stocks in the Stock Screener
EXEL Latest News and Analysis
 2 days ago - ChartmillWhy EXELIXIS INC (NASDAQ:EXEL) is Poised for High Growth.
Exploring high growth characteristics of EXELIXIS INC (NASDAQ:EXEL). A fundamental and technical analysis of (NASDAQ:EXEL).
 4 days ago - ChartmillEXELIXIS INC (NASDAQ:EXEL) qualifies as a high growth stock and is consolidating.
Based on a technical and fundamental analysis of NASDAQ:EXEL we can say: EXELIXIS INC (NASDAQ:EXEL), a strong growth stock, setting up for a breakout.
 13 days ago - ChartmillFor those who appreciate growth without the sticker shock, EXELIXIS INC (NASDAQ:EXEL) is worth considering.
EXELIXIS INC was identified as a growth stock that isn't overvalued. NASDAQ:EXEL is excelling in various growth indicators while maintaining a solid financial footing.
 15 days ago - ChartmillEXELIXIS INC (NASDAQ:EXEL) stands out as a stock that provides good value for the fundamentals it showcases.
EXELIXIS INC is a hidden gem, featuring undervaluation and robust fundamentals. NASDAQ:EXEL showcases decent financial health and profitability, coupled with an attractive price.
