
Market Monitor February 27th
By Kristoff De Turck - reviewed by Aldwin Keppens
Last update: Feb 28, 2025
Tech-Led Selloff Drags Markets Lower: Nasdaq Plunges 2.8% Amid Nvidia Slump and Broad Market Weakness
The U.S. markets closed lower, with the Dow Jones down by 0.5% and the Nasdaq taking a significant hit of 2.8%. The sharp decline in the Nasdaq was largely due to concerns around Nvidia, which plummeted by over 8%.
Despite Nvidia's robust quarterly results showing a 78% jump in revenue and strong demand for its Blackwell chips, the market remained jittery.
Analysts, however, praised Nvidia’s performance and outlook, indicating a continued strong demand for AI.
These concerns arose after Chinese company DeepSeek demonstrated that effective AI models could be built with relatively less computing power, sparking fears that big tech's massive AI investments might not yield expected returns, potentially leading to scaled-back investment plans.
Salesforce lost ground after issuing a weaker-than-expected forecast for the fiscal year, with revenue projections falling short of expectations. The company highlighted its focus on Agentforce, an AI tool designed to automate customer service tasks, though facing stiff competition from Microsoft and ServiceNow.
eBay's stock dropped about 8% after its first-quarter revenue guidance fell short of Wall Street's expectations. The company forecasted revenue between $2.52 billion and $2.56 billion, while analysts had estimated $2.59 billion.
However, eBay's fourth-quarter earnings and revenue exceeded expectations.
On a positive note, Snowflake saw its stock rise by 4.6% as it successfully boosted its fourth-quarter product revenue by 28%, surpassing expectations.
The company's recent innovations in AI services have led to a more optimistic view from investors, prompting JPMorgan to raise its price target for Snowflake, indicating a potential 20% upside from its current price.
Daily Market Analysis – February 27, 2025 (After Market Close)
Major Index Performance:
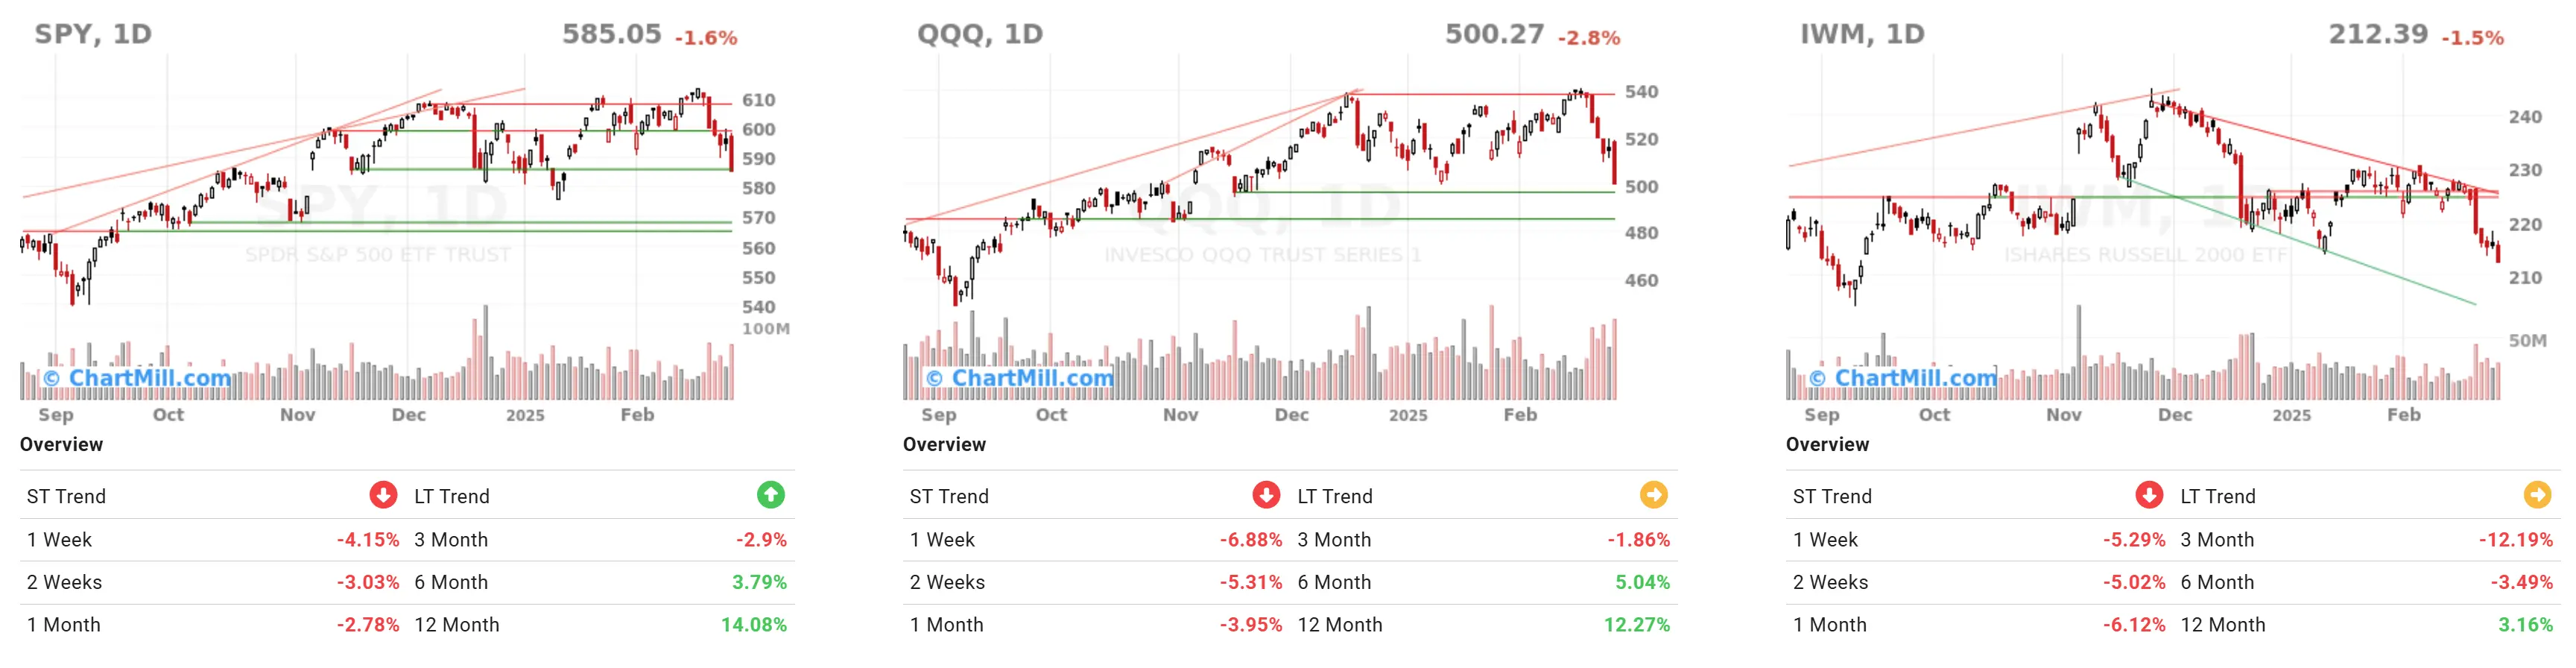
SPY (S&P 500 ETF): -1.6% on the day, with a short-term decline (1 week: -4.15%, 2 weeks: -3.03%, 1 month: -2.78%). However, the long-term trend - as measured by the ChartMill Trend Indicator - remains positive for now with a 14.08% rise (12 months).
QQQ (Nasdaq 100 ETF): -2.8% on the day, with weak short-term performance (1 week: -6.8%, 2 weeks: -5.31%). Longer-term (12 months) performance is still up 12.27%. The long-term picture is neutral.
IWM (Russell 2000 ETF): -1.5% on the day, with a negative trend over the past few months (3 months: -12.19%). The small-cap index performs weakest, although the 12-month trend is still just positive (+3.16%). Trend-wise, this index is still in neutral territory but it remains to be seen what the market does today for a final conclusion on a weekly basis.
The market is experiencing a correction in the short and medium term, with technology and growth stocks (QQQ) under particular pressure. Small-caps (IWM) have been showing weakness for some time.
Sector performance
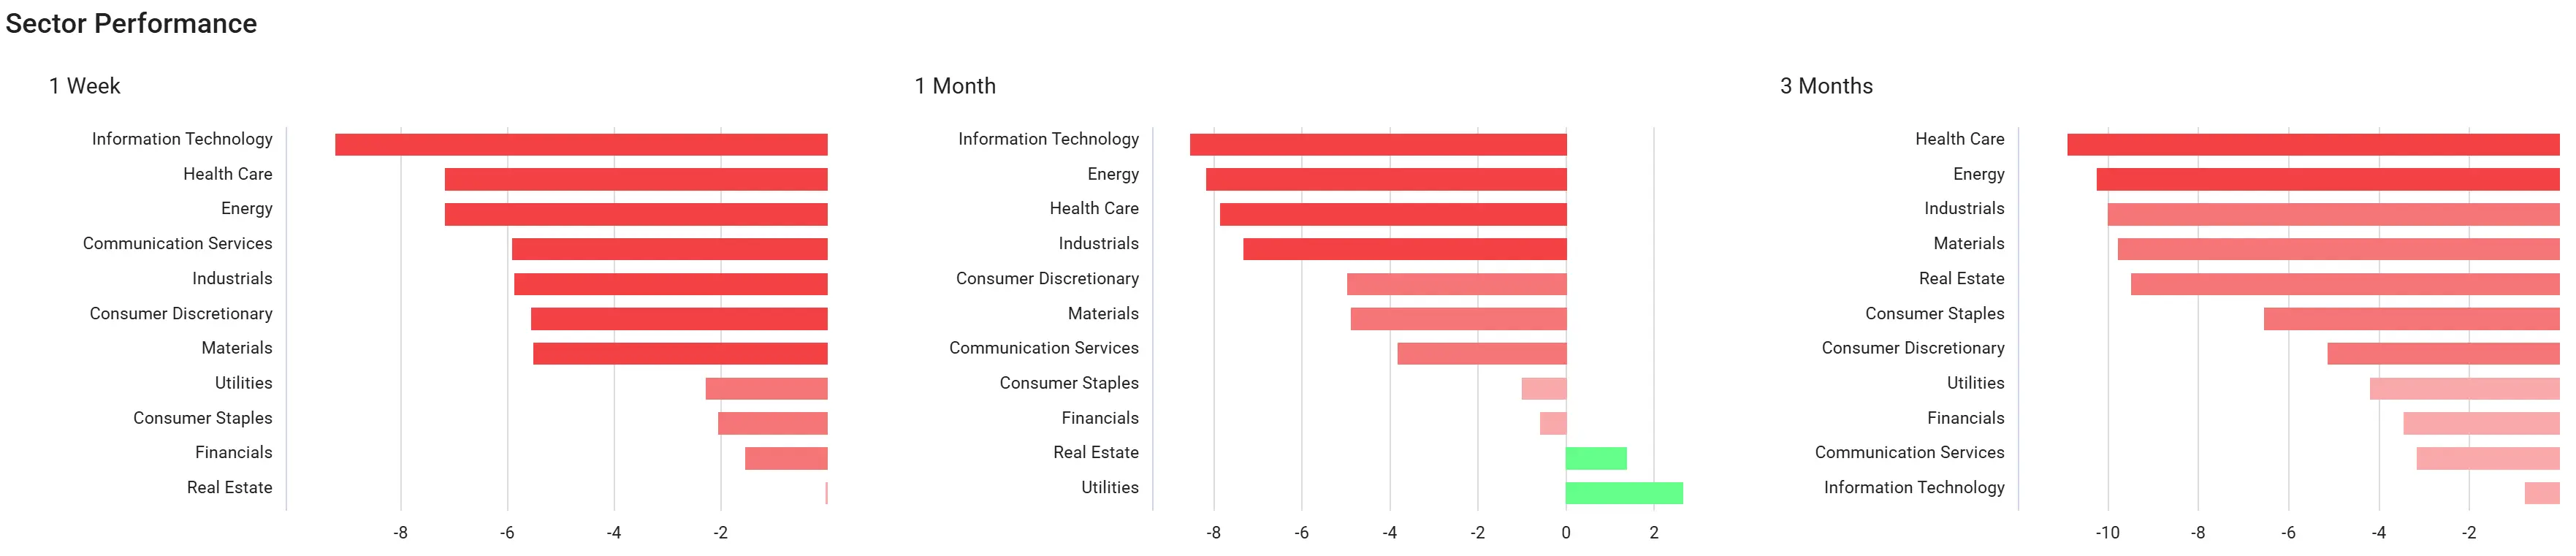
1 week: All sectors show negative returns, with the largest losses in information technology, health care and energy.
1 month: Red figures still dominate, with only real estate and Utilities able to turn out slightly green.
3 months: Sectors such as healthcare, energy and industrials lose more than 10% on average, only the information technology sector comes close to breakeven.
Short- and medium-term declines are broad-based across all sectors. This reflects the current structural weakness of equity markets.
Market Breadth Indicators (Historical Breadth).
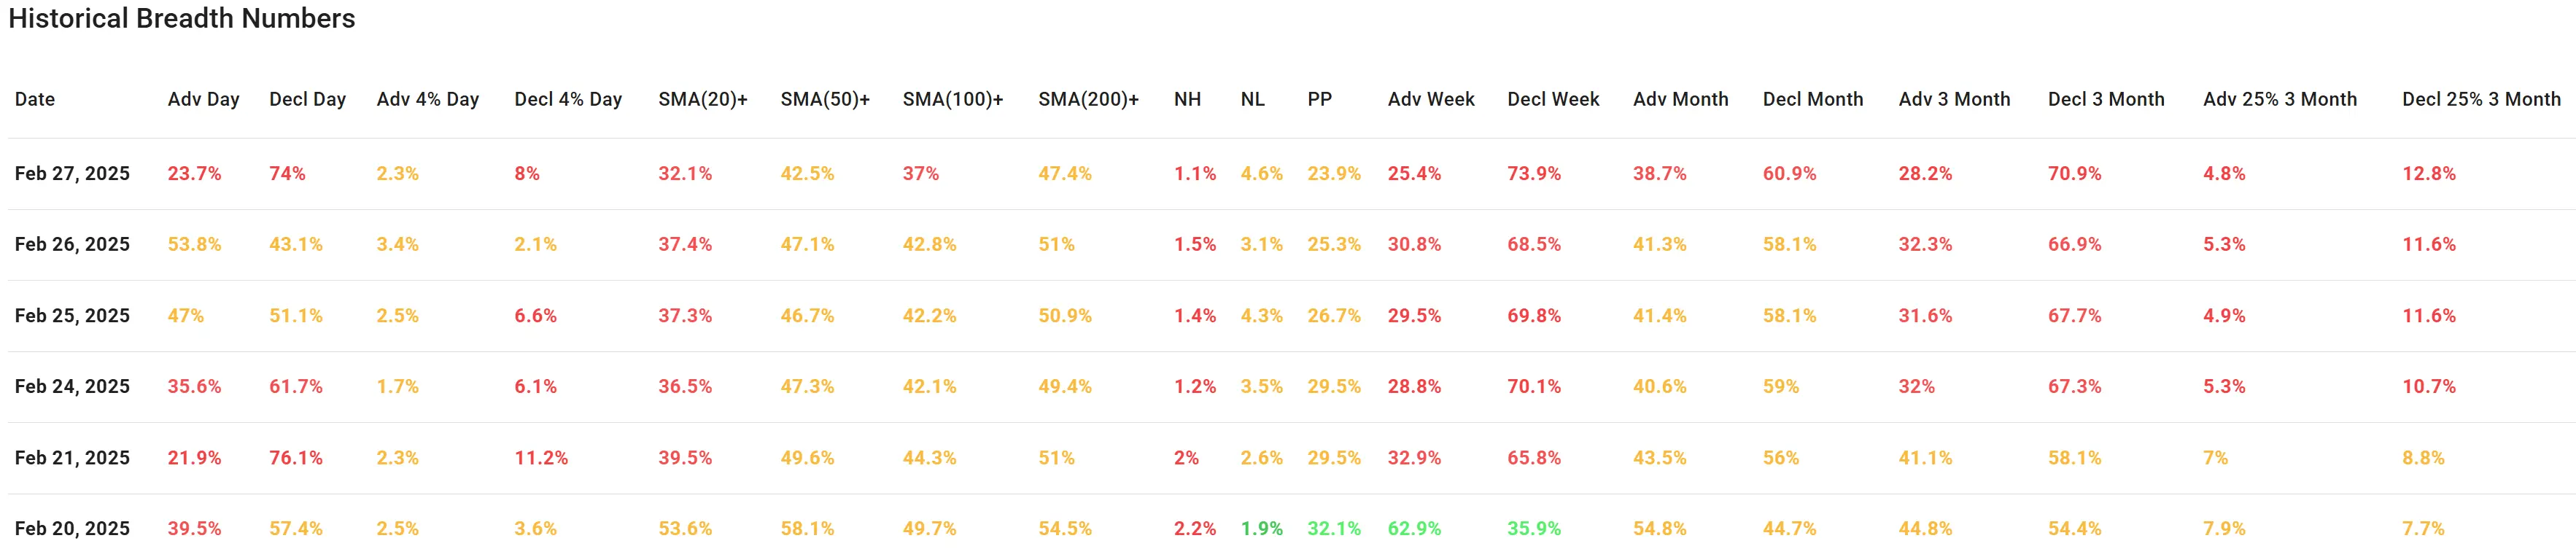
- Adv Day %: Only 23.7% of stocks closed higher, a sign of weakness.
- Adv 4% Day (stocks that rose >4%): Only 2.3%, indicating a lack of buying interest.
- SMA Trend: Only 37% of stocks are above their 50-day average, and 47.4% above the 200-day average - a sign that the market is in a correction phase.
- Weekly and monthly range: On a weekly basis only 25.4% gainers, and on a monthly basis only 38.7% - indicating broad market weakness.
Again clear sign of broad-based market decline, with few stocks showing significant strength.
Direct link to our Market Monitor page
Conclusion
The US stock market is in a weak phase, with a sharp correction in recent weeks. Especially technology (QQQ) and small-caps (IWM) are performing weakly. Broad market indicators show that only a small portion of stocks are rising and most are trading below their 50-day and 200-day averages.
This indicates increased market risk and possible further price declines in the near term. It is crucial for traders and investors to reduce risk and be cautious about new long positions until the market shows signs of stabilizing.
Holding a larger cash position is a worthy option in current market conditions!
NASDAQ:EBAY (4/21/2025, 3:09:04 PM)
64.84
-1.42 (-2.14%)
NASDAQ:MSFT (4/21/2025, 3:09:07 PM)
356.69
-11.09 (-3.02%)
NYSE:CRM (4/21/2025, 3:09:07 PM)
233.375
-13.88 (-5.62%)
NASDAQ:NVDA (4/21/2025, 3:09:10 PM)
95.725
-5.76 (-5.68%)
NYSE:NOW (4/21/2025, 3:08:55 PM)
746.28
-25.88 (-3.35%)
NYSE:SNOW (4/21/2025, 3:09:03 PM)
136.105
-7.33 (-5.11%)
Find more stocks in the Stock Screener
