EBAY INC (NASDAQ:EBAY) showing some interesting technicals. Here's why.
By Mill Chart
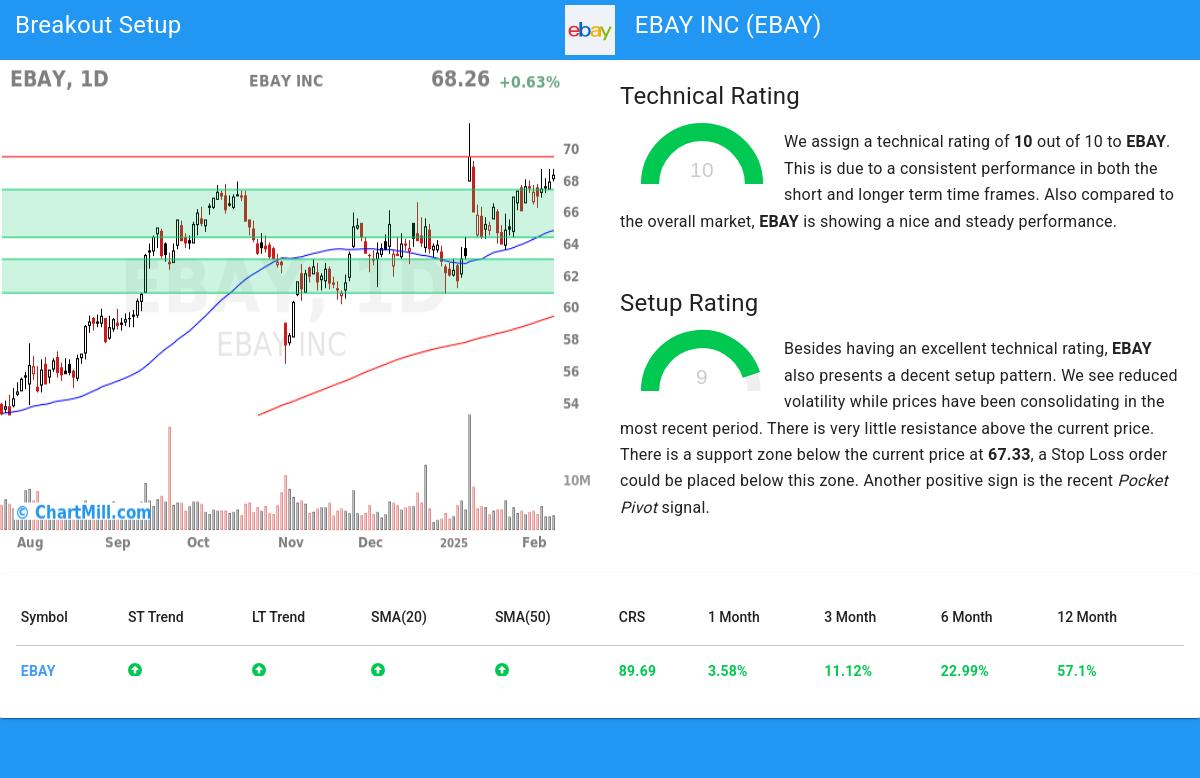
Last update: Feb 11, 2025
Our stockscreener has identified a possible breakout setup on EBAY INC (NASDAQ:EBAY). This occurs when the stock consolidates following a significant upward movement. While the breakout outcome cannot be guaranteed, it may be worth monitoring NASDAQ:EBAY for potential opportunities.
Deciphering the Technical Picture of NASDAQ:EBAY
At ChartMill, a crucial aspect of their analysis is the assignment of a Technical Rating to each stock. This rating, ranging from 0 to 10, is calculated daily by considering numerous technical indicators and properties.
Taking everything into account, EBAY scores 10 out of 10 in our technical rating. This is due to a consistent performance in both the short and longer term time frames. Also compared to the overall market, EBAY is showing a nice and steady performance.
- Both the short term and long term trends are positive. This is a very positive sign.
- When comparing the yearly performance of all stocks, we notice that EBAY is one of the better performing stocks in the market, outperforming 89% of all stocks. On top of that, EBAY also shows a nice and consistent pattern of rising prices.
- EBAY is part of the Broadline Retail industry. There are 32 other stocks in this industry. EBAY outperforms 77% of them.
- EBAY is currently trading in the upper part of its 52 week range. The S&P500 Index however is currently trading near a new high, so EBAY is lagging the market slightly.
- In the last month EBAY has a been trading in the 63.50 - 68.65 range, which is quite wide. It is currently trading near the high of this range.
Check the latest full technical report of EBAY for a complete technical analysis.
Looking at the Setup
ChartMill incorporates a Setup Rating in its analysis, which measures the extent of consolidation in a stock over recent days and weeks. This rating, ranging from 0 to 10, is updated daily and takes into account multiple short-term technical indicators. The current setup rating for NASDAQ:EBAY is 9:
EBAY has an excellent technical rating and also presents a decent setup pattern. Prices have been consolidating lately and the volatility has been reduced. There is very little resistance above the current price. There is a support zone below the current price at 67.33, a Stop Loss order could be placed below this zone. Very recently a Pocket Pivot signal was observed. This is another positive sign.
How can NASDAQ:EBAY be traded?
For a potential trade one would typically wait until the stock breaks out of the consolidation zone to enter the stock and it could be sold again for a loss when it would fall back below the zone.
Please note that this article should not be construed as trading advice. The information provided is solely based on automated technical analysis and serves to highlight technical observations. It is important to conduct your own analysis and make trading decisions based on your own judgment and responsibility.
More breakout setups can be found in our Breakout screener.
Disclaimer
This is not investing advice! The article highlights some of the observations at the time of writing, but you should always make your own analysis and invest based on your own insights.
NASDAQ:EBAY (2/19/2025, 3:25:09 PM)
69.35
-0.44 (-0.63%)
Find more stocks in the Stock Screener
EBAY Latest News and Analysis
 8 days ago - ChartmillEBAY INC (NASDAQ:EBAY) showing some interesting technicals. Here's why.
Exploring EBAY INC's Technical Signals and Breakout Potential: EBAY INC is showing promising signs of setting up for a breakout.
14 days ago - ChartmillGood technical signals and a possible breakout for EBAY INC.Exploring EBAY INC's Technical Signals and Breakout Potential: Indications Suggest NASDAQ:EBAY Could Be on the Verge of a Breakout.
