
Technical Setup: COSTCO WHOLESALE CORP Appears Poised for a Breakout.
By Mill Chart
Last update: Oct 25, 2024
COSTCO WHOLESALE CORP (NASDAQ:COST) has been identified as a Technical Breakout Setup Pattern by our stock screener. This pattern typically occurs when a stock takes a pause after a significant rise, indicating the possibility of a continuation in the trend. While it's impossible to predict with certainty, it might be beneficial to monitor NASDAQ:COST.
In-Depth Technical Analysis of NASDAQ:COST
As part of its analysis, ChartMill provides a comprehensive Technical Rating for each stock. This rating, ranging from 0 to 10, is updated on a daily basis and is based on the evaluation of various technical indicators and properties.
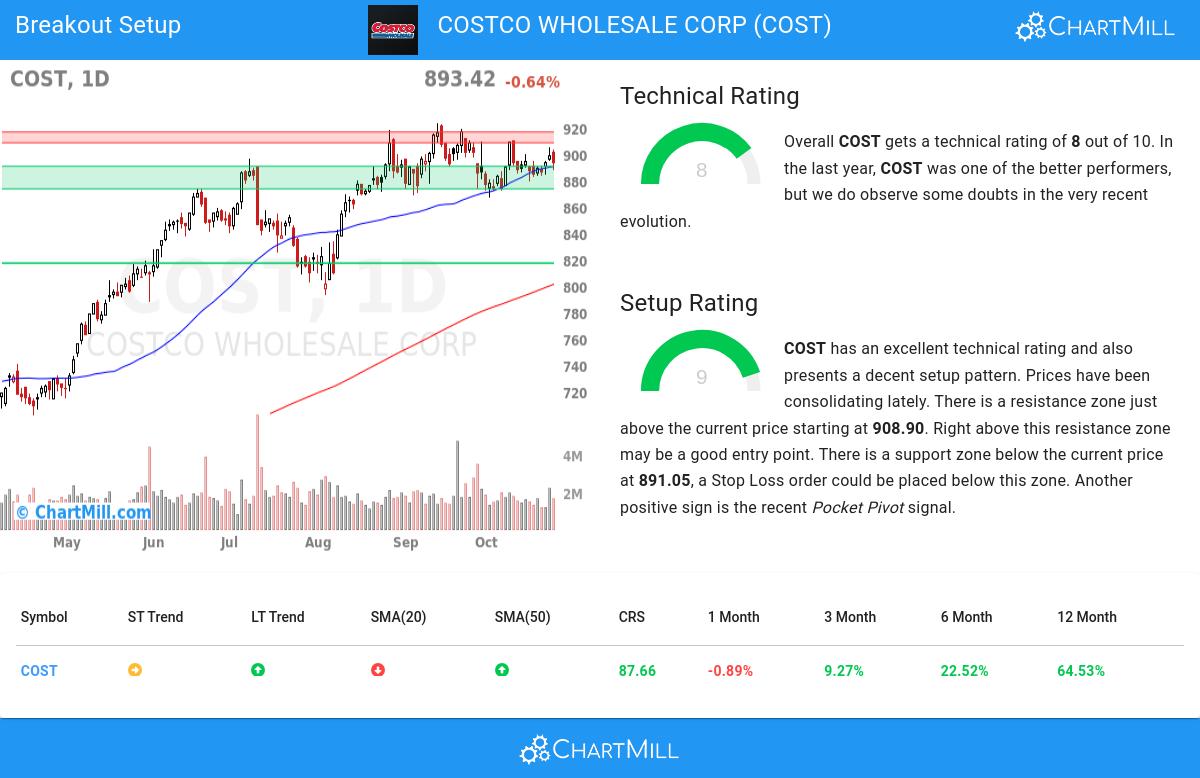
We assign a technical rating of 8 out of 10 to COST. This is due to a consistent overall performance, although we see some doubts in the very recent evolution. In the medium time frame things are still looking good.
- The long term trend is positive and the short term trend is neutral. The long term trend may just continue or reversal may be around the corner!
- Looking at the yearly performance, COST did better than 87% of all other stocks. We also observe that the gains produced by COST over the past year are nicely spread over this period.
- COST is one of the better performing stocks in the Consumer Staples Distribution & Retail industry, it outperforms 82% of 40 stocks in the same industry.
- COST is currently trading near its 52 week high, which is a good sign. The S&P500 Index however is also trading near new highs, which makes the performance in line with the market.
- In the last month COST has a been trading in a tight range between 867.16 and 910.00.
Our latest full technical report of COST contains the most current technical analsysis.
How do we evaluate the setup for NASDAQ:COST?
Next to the Technical Rating, the Setup Rating of a stock determines to which extend the stock is consolidating. This score also ranges from 0 to 10 and is updated daily. The setup score evaluates various short term technical indicators. For NASDAQ:COST this score is currently 9:
COST has an excellent technical rating and also presents a decent setup pattern. Prices have been consolidating lately. There is a resistance zone just above the current price starting at 908.90. Right above this resistance zone may be a good entry point. There is a support zone below the current price at 891.05, a Stop Loss order could be placed below this zone. Very recently a Pocket Pivot signal was observed. This is another positive sign.
Trading breakout setups.
One way to play this would be to wait for the actual breakout to happen and buy when the stock breaks out above the current consolidation zone. A possible place for a stop loss would be below this zone.
This article should in no way be interpreted as trading advice. You should always make your own analysis and trade or not trade based on your own observations and style. The article is based purely on some technical observations.
More breakout setups can be found in our Breakout screener.
Keep in mind
This is not investing advice! The article highlights some of the observations at the time of writing, but you should always make your own analysis and invest based on your own insights.
1062.54
+6.51 (+0.62%)
Find more stocks in the Stock Screener
COST Latest News and Analysis
 12 hours ago - ChartmillWhy Quality-Oriented Investors Should Consider NASDAQ:COST.
A fundamental analysis of (NASDAQ:COST): Why NASDAQ:COST Stands Out as a Quality Stock.
 16 days ago - ChartmillExploring the top movers within the S&P500 index during today's session.
Let's delve into the developments on the US markets one hour before the close of the markets on Monday. Below, you'll find the top gainers and losers within the S&P500 index during today's session.
16 days ago - ChartmillTop S&P500 movers in Monday's sessionStay informed about the performance of the S&P500 index in the middle of the day on Monday. Uncover the top gainers and losers in today's session for valuable insights.
