When you look at NASDAQ:BLBD, it's hard to ignore the strong fundamentals, especially considering its likely undervaluation.
By Mill Chart
Last update: Feb 13, 2025
Uncover the potential of BLUE BIRD CORP (NASDAQ:BLBD) as our stock screener's choice for an undervalued stock. NASDAQ:BLBD maintains a strong financial position and offers an appealing valuation. We'll delve into the specifics below.
What does the Valuation looks like for NASDAQ:BLBD
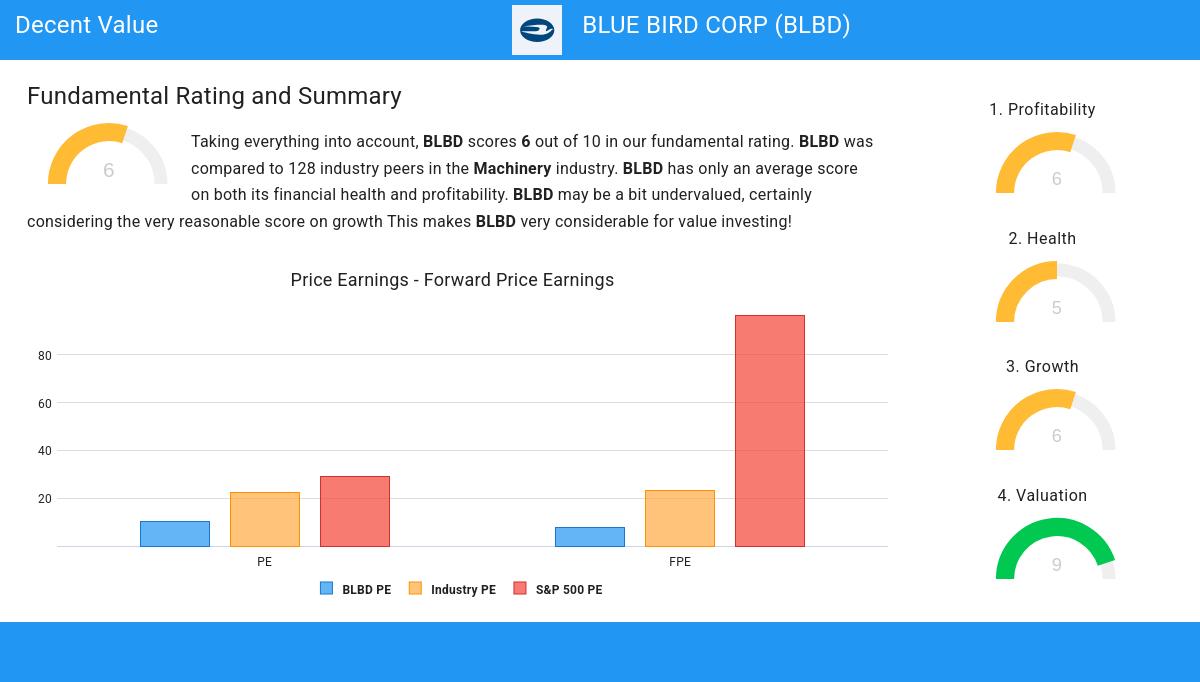
ChartMill assigns a Valuation Rating to every stock. This score ranges from 0 to 10 and evaluates the different valuation aspects and compares the price to earnings and cash flows, while taking into account profitability and growth. NASDAQ:BLBD scores a 9 out of 10:
- With a Price/Earnings ratio of 10.23, the valuation of BLBD can be described as very reasonable.
- Compared to the rest of the industry, the Price/Earnings ratio of BLBD indicates a rather cheap valuation: BLBD is cheaper than 92.80% of the companies listed in the same industry.
- When comparing the Price/Earnings ratio of BLBD to the average of the S&P500 Index (28.99), we can say BLBD is valued rather cheaply.
- Based on the Price/Forward Earnings ratio of 7.89, the valuation of BLBD can be described as very cheap.
- Based on the Price/Forward Earnings ratio, BLBD is valued cheaply inside the industry as 96.80% of the companies are valued more expensively.
- The average S&P500 Price/Forward Earnings ratio is at 96.58. BLBD is valued rather cheaply when compared to this.
- BLBD's Enterprise Value to EBITDA ratio is rather cheap when compared to the industry. BLBD is cheaper than 86.40% of the companies in the same industry.
- BLBD's Price/Free Cash Flow ratio is rather cheap when compared to the industry. BLBD is cheaper than 94.40% of the companies in the same industry.
- BLBD's low PEG Ratio(NY), which compensates the Price/Earnings for growth, indicates a rather cheap valuation of the company.
- The decent profitability rating of BLBD may justify a higher PE ratio.
Understanding NASDAQ:BLBD's Profitability
ChartMill assigns a proprietary Profitability Rating to each stock. The score is computed by evaluating various profitability ratios and margins and ranges from 0 to 10. NASDAQ:BLBD was assigned a score of 6 for profitability:
- The Return On Assets of BLBD (20.20%) is better than 96.80% of its industry peers.
- BLBD has a better Return On Equity (60.16%) than 98.40% of its industry peers.
- BLBD's Return On Invested Capital of 30.58% is amongst the best of the industry. BLBD outperforms 98.40% of its industry peers.
- BLBD has a Profit Margin of 8.05%. This is in the better half of the industry: BLBD outperforms 64.00% of its industry peers.
- In the last couple of years the Profit Margin of BLBD has grown nicely.
- In the last couple of years the Operating Margin of BLBD has grown nicely.
- In the last couple of years the Gross Margin of BLBD has grown nicely.
A Closer Look at Health for NASDAQ:BLBD
ChartMill employs its own Health Rating for stock assessment. This rating, ranging from 0 to 10, is calculated by examining various liquidity and solvency ratios. In the case of NASDAQ:BLBD, the assigned 5 reflects its health status:
- An Altman-Z score of 5.56 indicates that BLBD is not in any danger for bankruptcy at the moment.
- BLBD has a Altman-Z score of 5.56. This is in the better half of the industry: BLBD outperforms 76.80% of its industry peers.
- The Debt to FCF ratio of BLBD is 0.78, which is an excellent value as it means it would take BLBD, only 0.78 years of fcf income to pay off all of its debts.
- BLBD's Debt to FCF ratio of 0.78 is amongst the best of the industry. BLBD outperforms 88.00% of its industry peers.
- A Debt/Equity ratio of 0.49 indicates that BLBD is not too dependend on debt financing.
Assessing Growth for NASDAQ:BLBD
ChartMill employs its own Growth Rating system for all stocks. This score, ranging from 0 to 10, is derived by evaluating different growth factors, such as EPS and revenue growth, taking into account both past performance and future projections. NASDAQ:BLBD has earned a 6 for growth:
- BLBD shows a strong growth in Earnings Per Share. In the last year, the EPS has been growing by 53.07%, which is quite impressive.
- Measured over the past years, BLBD shows a quite strong growth in Earnings Per Share. The EPS has been growing by 16.38% on average per year.
- BLBD shows quite a strong growth in Revenue. In the last year, the Revenue has grown by 10.59%.
- BLBD is expected to show quite a strong growth in Earnings Per Share. In the coming years, the EPS will grow by 9.01% yearly.
- BLBD is expected to show quite a strong growth in Revenue. In the coming years, the Revenue will grow by 8.93% yearly.
- The Revenue growth rate is accelerating: in the next years the growth will be better than in the last years.
Every day, new Decent Value stocks can be found on ChartMill in our Decent Value screener.
Check the latest full fundamental report of BLBD for a complete fundamental analysis.
Keep in mind
Important Note: The content of this article is not intended as trading advice. It is essential to perform your own analysis and exercise caution when making trading decisions. The article presents observations created by automated analysis but does not guarantee any trading or investment outcomes. Always trade responsibly and make independent judgments.
NASDAQ:BLBD (2/19/2025, 3:22:31 PM)
35.2
+0.56 (+1.62%)
Find more stocks in the Stock Screener
BLBD Latest News and Analysis
 6 days ago - ChartmillWhen you look at NASDAQ:BLBD, it's hard to ignore the strong fundamentals, especially considering its likely undervaluation.
When you look at BLUE BIRD CORP (NASDAQ:BLBD), it's hard to ignore the strong fundamentals, especially considering its likely undervaluation.
 14 days ago - ChartmillThese stocks are moving in today's after hours session
After the conclusion of the US market's regular session on Wednesday, let's examine the after-hours session and unveil the notable performers among the top gainers and losers.
