
Despite its impressive fundamentals, NYSE:ANF remains undervalued.
By Mill Chart
Last update: Feb 17, 2025
ABERCROMBIE & FITCH CO-CL A (NYSE:ANF) was identified as a decent value stock by our stock screener. NYSE:ANF scores well on profitability, solvency and liquidity. At the same time it seems to be priced very reasonably. We'll explore this a bit deeper below.
Valuation Insights: NYSE:ANF
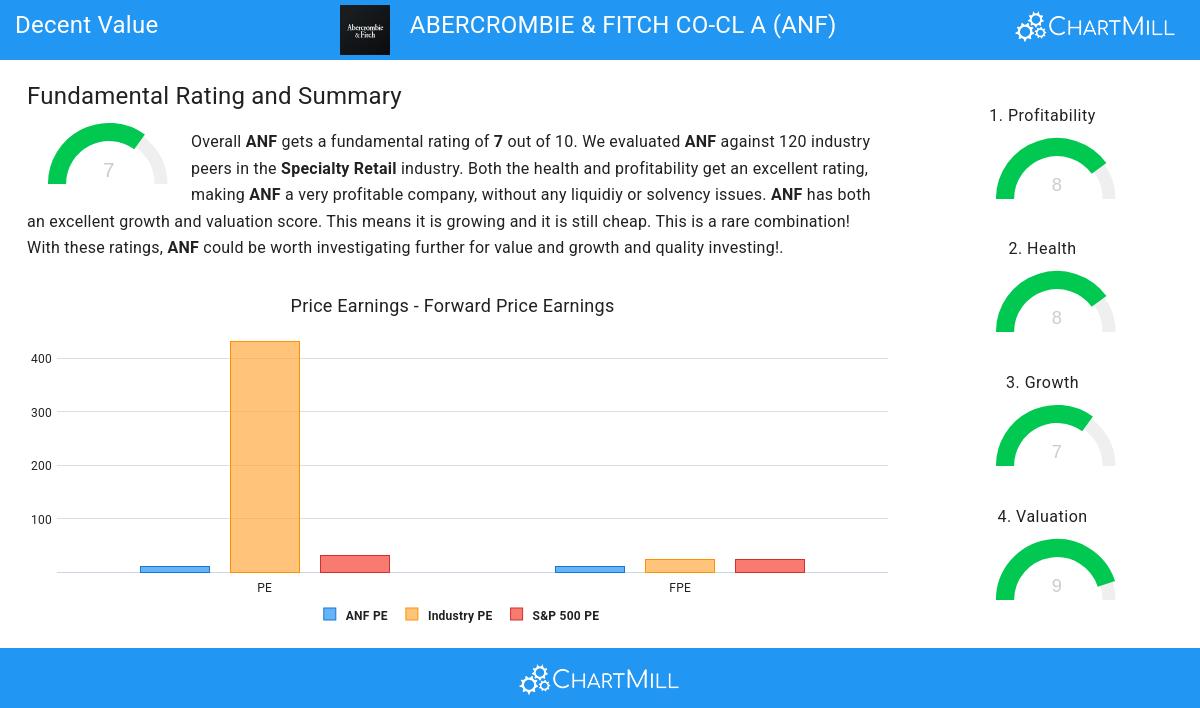
ChartMill assigns a proprietary Valuation Rating to each stock. The score is computed by evaluating various valuation aspects, like price to earnings and free cash flow, both absolutely as relative to the market and industry. NYSE:ANF was assigned a score of 9 for valuation:
- The Price/Earnings ratio is 11.09, which indicates a very decent valuation of ANF.
- 86.32% of the companies in the same industry are more expensive than ANF, based on the Price/Earnings ratio.
- ANF is valuated cheaply when we compare the Price/Earnings ratio to 30.11, which is the current average of the S&P500 Index.
- With a Price/Forward Earnings ratio of 10.08, the valuation of ANF can be described as very reasonable.
- Based on the Price/Forward Earnings ratio, ANF is valued cheaply inside the industry as 85.47% of the companies are valued more expensively.
- When comparing the Price/Forward Earnings ratio of ANF to the average of the S&P500 Index (23.58), we can say ANF is valued rather cheaply.
- Based on the Enterprise Value to EBITDA ratio, ANF is valued cheaply inside the industry as 85.47% of the companies are valued more expensively.
- Based on the Price/Free Cash Flow ratio, ANF is valued cheaply inside the industry as 83.76% of the companies are valued more expensively.
- ANF's low PEG Ratio(NY), which compensates the Price/Earnings for growth, indicates a rather cheap valuation of the company.
- The excellent profitability rating of ANF may justify a higher PE ratio.
- A more expensive valuation may be justified as ANF's earnings are expected to grow with 25.17% in the coming years.
How do we evaluate the Profitability for NYSE:ANF?
Discover ChartMill's exclusive Profitability Rating, a proprietary metric that assesses stocks on a scale of 0 to 10. It takes into consideration various profitability ratios and margins, both in absolute terms and relative to industry peers. Notably, NYSE:ANF has achieved a 8:
- ANF has a Return On Assets of 16.45%. This is amongst the best in the industry. ANF outperforms 94.87% of its industry peers.
- Looking at the Return On Equity, with a value of 41.58%, ANF belongs to the top of the industry, outperforming 92.31% of the companies in the same industry.
- With an excellent Return On Invested Capital value of 26.56%, ANF belongs to the best of the industry, outperforming 94.02% of the companies in the same industry.
- The last Return On Invested Capital (26.56%) for ANF is above the 3 year average (12.86%), which is a sign of increasing profitability.
- ANF's Profit Margin of 10.76% is amongst the best of the industry. ANF outperforms 94.02% of its industry peers.
- ANF's Profit Margin has improved in the last couple of years.
- With an excellent Operating Margin value of 14.40%, ANF belongs to the best of the industry, outperforming 93.16% of the companies in the same industry.
- ANF's Operating Margin has improved in the last couple of years.
- The Gross Margin of ANF (64.60%) is better than 93.16% of its industry peers.
Health Assessment of NYSE:ANF
ChartMill assigns a proprietary Health Rating to each stock. The score is computed by evaluating various liquidity and solvency ratios and ranges from 0 to 10. NYSE:ANF was assigned a score of 8 for health:
- ANF has an Altman-Z score of 5.60. This indicates that ANF is financially healthy and has little risk of bankruptcy at the moment.
- ANF's Altman-Z score of 5.60 is amongst the best of the industry. ANF outperforms 90.60% of its industry peers.
- ANF has no outstanding debt. Therefor its Debt/Equity and Debt/FCF ratios are 0 and belong to the best of the industry.
- ANF has a Quick ratio of 0.93. This is in the better half of the industry: ANF outperforms 72.65% of its industry peers.
- The current and quick ratio evaluation for ANF is rather negative, while it does have excellent solvency and profitability. These ratios do not necessarly indicate liquidity issues and need to be evaluated against the specifics of the business.
Deciphering NYSE:ANF's Growth Rating
ChartMill employs its own Growth Rating system for all stocks. This score, ranging from 0 to 10, is derived by evaluating different growth factors, such as EPS and revenue growth, taking into account both past performance and future projections. NYSE:ANF has earned a 7 for growth:
- ANF shows a strong growth in Earnings Per Share. In the last year, the EPS has been growing by 144.79%, which is quite impressive.
- Measured over the past years, ANF shows a very strong growth in Earnings Per Share. The EPS has been growing by 39.75% on average per year.
- Looking at the last year, ANF shows a quite strong growth in Revenue. The Revenue has grown by 19.59% in the last year.
- Based on estimates for the next years, ANF will show a very strong growth in Earnings Per Share. The EPS will grow by 25.17% on average per year.
- Based on estimates for the next years, ANF will show a quite strong growth in Revenue. The Revenue will grow by 8.75% on average per year.
- When comparing the Revenue growth rate of the last years to the growth rate of the upcoming years, we see that the growth is accelerating.
Every day, new Decent Value stocks can be found on ChartMill in our Decent Value screener.
Check the latest full fundamental report of ANF for a complete fundamental analysis.
Disclaimer
Important Note: The content of this article is not intended as trading advice. It is essential to perform your own analysis and exercise caution when making trading decisions. The article presents observations created by automated analysis but does not guarantee any trading or investment outcomes. Always trade responsibly and make independent judgments.
