
Investors seeking growth at a reasonable cost should explore NYSE:ANF.
By Mill Chart
Last update: Feb 11, 2025
ABERCROMBIE & FITCH CO-CL A (NYSE:ANF) has caught the eye of our stock screener as an affordable growth stock. NYSE:ANF is displaying robust growth metrics and also excels in terms of profitability, solvency, and liquidity. Additionally, it appears to be reasonably priced. Let's delve into the details.
ChartMill's Evaluation of Growth
ChartMill assigns a Growth Rating to every stock. This score ranges from 0 to 10 and evaluates the different growth aspects like EPS and Revenue, both in the past as in the future. NYSE:ANF scores a 7 out of 10:
- ANF shows a strong growth in Earnings Per Share. In the last year, the EPS has been growing by 144.79%, which is quite impressive.
- Measured over the past years, ANF shows a very strong growth in Earnings Per Share. The EPS has been growing by 39.75% on average per year.
- The Revenue has grown by 19.59% in the past year. This is quite good.
- Based on estimates for the next years, ANF will show a very strong growth in Earnings Per Share. The EPS will grow by 25.17% on average per year.
- The Revenue is expected to grow by 8.75% on average over the next years. This is quite good.
- The Revenue growth rate is accelerating: in the next years the growth will be better than in the last years.
Unpacking NYSE:ANF's Valuation Rating
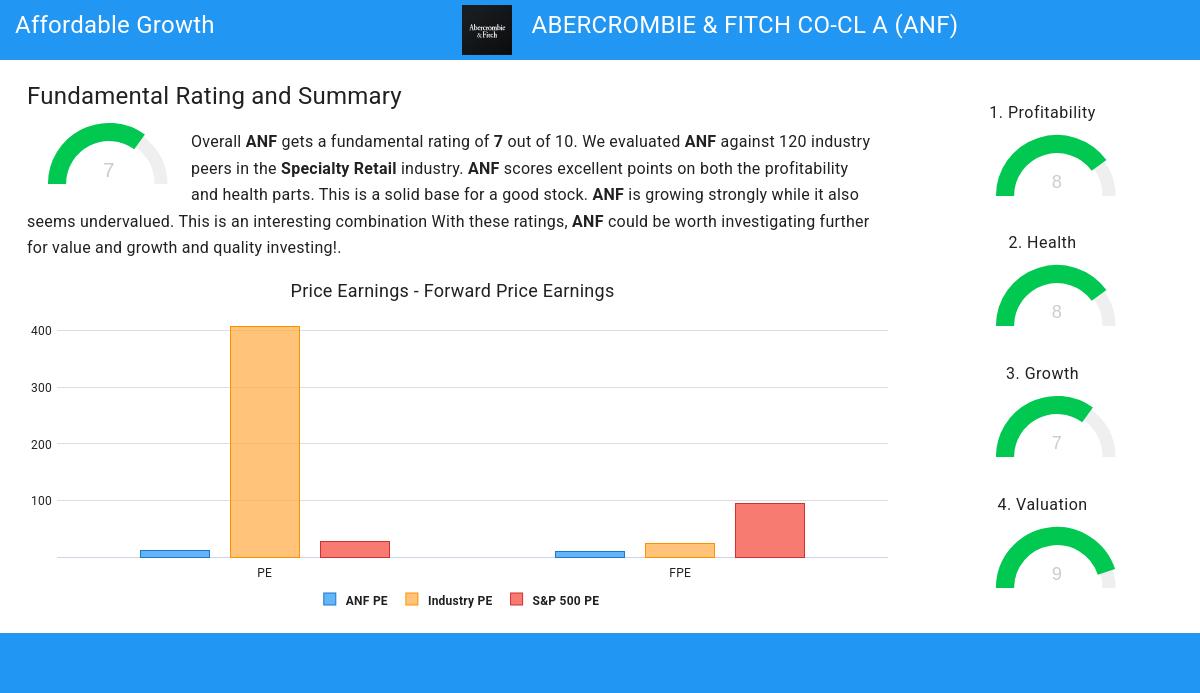
ChartMill employs its own Valuation Rating system for all stocks. This score, ranging from 0 to 10, is determined by evaluating different valuation factors, including price to earnings and free cash flow, both in absolute terms and relative to the market and industry. NYSE:ANF has earned a 9 for valuation:
- A Price/Earnings ratio of 11.20 indicates a reasonable valuation of ANF.
- Compared to the rest of the industry, the Price/Earnings ratio of ANF indicates a rather cheap valuation: ANF is cheaper than 85.47% of the companies listed in the same industry.
- When comparing the Price/Earnings ratio of ANF to the average of the S&P500 Index (28.20), we can say ANF is valued rather cheaply.
- Based on the Price/Forward Earnings ratio of 10.18, the valuation of ANF can be described as reasonable.
- Compared to the rest of the industry, the Price/Forward Earnings ratio of ANF indicates a rather cheap valuation: ANF is cheaper than 83.76% of the companies listed in the same industry.
- When comparing the Price/Forward Earnings ratio of ANF to the average of the S&P500 Index (94.48), we can say ANF is valued rather cheaply.
- Based on the Enterprise Value to EBITDA ratio, ANF is valued cheaper than 84.62% of the companies in the same industry.
- Based on the Price/Free Cash Flow ratio, ANF is valued cheaper than 83.76% of the companies in the same industry.
- The low PEG Ratio(NY), which compensates the Price/Earnings for growth, indicates a rather cheap valuation of the company.
- ANF has an outstanding profitability rating, which may justify a higher PE ratio.
- ANF's earnings are expected to grow with 25.17% in the coming years. This may justify a more expensive valuation.
A Closer Look at Health for NYSE:ANF
ChartMill assigns a Health Rating to every stock. This score ranges from 0 to 10 and evaluates the different health aspects like liquidity and solvency, both absolutely, but also relative to the industry peers. NYSE:ANF scores a 8 out of 10:
- An Altman-Z score of 5.62 indicates that ANF is not in any danger for bankruptcy at the moment.
- ANF's Altman-Z score of 5.62 is amongst the best of the industry. ANF outperforms 89.74% of its industry peers.
- ANF has no outstanding debt. Therefor its Debt/Equity and Debt/FCF ratios are 0 and belong to the best of the industry.
- ANF's Quick ratio of 0.93 is fine compared to the rest of the industry. ANF outperforms 72.65% of its industry peers.
- ANF does not score too well on the current and quick ratio evaluation. However, as it has excellent solvency and profitability, these ratios do not necessarly indicate liquidity issues and need to be evaluated against the specifics of the business.
Assessing Profitability for NYSE:ANF
ChartMill employs its own Profitability Rating system for stock evaluation. This score, ranging from 0 to 10, is derived from an analysis of diverse profitability metrics and margins. In the case of NYSE:ANF, the assigned 8 is noteworthy for profitability:
- Looking at the Return On Assets, with a value of 16.45%, ANF belongs to the top of the industry, outperforming 94.87% of the companies in the same industry.
- With an excellent Return On Equity value of 41.58%, ANF belongs to the best of the industry, outperforming 92.31% of the companies in the same industry.
- ANF has a Return On Invested Capital of 26.56%. This is amongst the best in the industry. ANF outperforms 94.02% of its industry peers.
- The 3 year average ROIC (12.86%) for ANF is below the current ROIC(26.56%), indicating increased profibility in the last year.
- ANF has a better Profit Margin (10.76%) than 94.02% of its industry peers.
- In the last couple of years the Profit Margin of ANF has grown nicely.
- Looking at the Operating Margin, with a value of 14.40%, ANF belongs to the top of the industry, outperforming 93.16% of the companies in the same industry.
- ANF's Operating Margin has improved in the last couple of years.
- Looking at the Gross Margin, with a value of 64.60%, ANF belongs to the top of the industry, outperforming 93.16% of the companies in the same industry.
More Affordable Growth stocks can be found in our Affordable Growth screener.
For an up to date full fundamental analysis you can check the fundamental report of ANF
Disclaimer
Important Note: The content of this article is not intended as trading advice. It is essential to perform your own analysis and exercise caution when making trading decisions. The article presents observations created by automated analysis but does not guarantee any trading or investment outcomes. Always trade responsibly and make independent judgments.
