Don't overlook NYSE:ANF—a stock with solid growth prospects and a reasonable valuation.
By Mill Chart
Last update: Sep 13, 2024
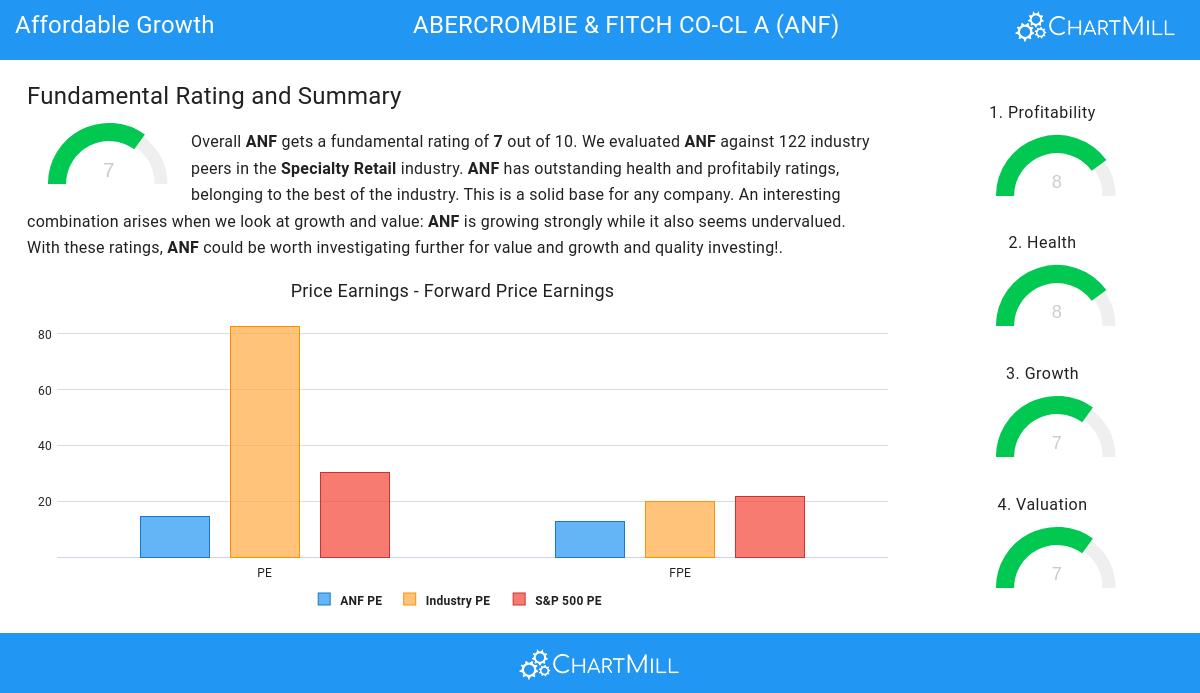
Consider ABERCROMBIE & FITCH CO-CL A (NYSE:ANF) as an affordable growth stock, identified by our stock screening tool. NYSE:ANF is showcasing impressive growth figures and is well-positioned in terms of profitability, solvency, and liquidity. Moreover, it seems to be priced reasonably. Let's dive deeper into the analysis.
Evaluating Growth: NYSE:ANF
Every stock receives a Growth Rating from ChartMill, ranging from 0 to 10. This rating assesses various growth aspects, including historical and projected EPS and revenue growth. NYSE:ANF boasts a 7 out of 10:
- The Earnings Per Share has grown by an impressive 308.66% over the past year.
- The Earnings Per Share has been growing by 39.75% on average over the past years. This is a very strong growth
- ANF shows a strong growth in Revenue. In the last year, the Revenue has grown by 21.11%.
- ANF is expected to show a strong growth in Earnings Per Share. In the coming years, the EPS will grow by 22.59% yearly.
- The Revenue growth rate is accelerating: in the next years the growth will be better than in the last years.
Valuation Insights: NYSE:ANF
An integral part of ChartMill's stock analysis is the Valuation Rating, which spans from 0 to 10. This rating evaluates diverse valuation factors, including price to earnings and cash flows, while considering the stock's profitability and growth. NYSE:ANF has received a 7 out of 10:
- Based on the Price/Earnings ratio, ANF is valued a bit cheaper than 72.73% of the companies in the same industry.
- Compared to an average S&P500 Price/Earnings ratio of 30.24, ANF is valued rather cheaply.
- Based on the Price/Forward Earnings ratio, ANF is valued a bit cheaper than 71.07% of the companies in the same industry.
- Compared to an average S&P500 Price/Forward Earnings ratio of 21.81, ANF is valued a bit cheaper.
- Based on the Enterprise Value to EBITDA ratio, ANF is valued a bit cheaper than the industry average as 65.29% of the companies are valued more expensively.
- Compared to the rest of the industry, the Price/Free Cash Flow ratio of ANF indicates a somewhat cheap valuation: ANF is cheaper than 78.51% of the companies listed in the same industry.
- ANF's low PEG Ratio(NY), which compensates the Price/Earnings for growth, indicates a rather cheap valuation of the company.
- ANF has an outstanding profitability rating, which may justify a higher PE ratio.
- A more expensive valuation may be justified as ANF's earnings are expected to grow with 22.59% in the coming years.
Assessing Health Metrics for NYSE:ANF
ChartMill employs a unique Health Rating system for all stocks. This rating, ranging from 0 to 10, is determined by analyzing various liquidity and solvency ratios. For NYSE:ANF, the assigned 8 for health provides valuable insights:
- An Altman-Z score of 5.92 indicates that ANF is not in any danger for bankruptcy at the moment.
- Looking at the Altman-Z score, with a value of 5.92, ANF belongs to the top of the industry, outperforming 93.39% of the companies in the same industry.
- ANF has a debt to FCF ratio of 0.36. This is a very positive value and a sign of high solvency as it would only need 0.36 years to pay back of all of its debts.
- ANF has a better Debt to FCF ratio (0.36) than 84.30% of its industry peers.
- ANF has a Debt/Equity ratio of 0.20. This is a healthy value indicating a solid balance between debt and equity.
- ANF's Debt to Equity ratio of 0.20 is fine compared to the rest of the industry. ANF outperforms 60.33% of its industry peers.
- ANF has a Current ratio of 1.64. This is in the better half of the industry: ANF outperforms 67.77% of its industry peers.
- The Quick ratio of ANF (1.15) is better than 79.34% of its industry peers.
Assessing Profitability for NYSE:ANF
ChartMill assigns a proprietary Profitability Rating to each stock. The score is computed by evaluating various profitability ratios and margins and ranges from 0 to 10. NYSE:ANF was assigned a score of 8 for profitability:
- ANF's Return On Assets of 14.32% is amongst the best of the industry. ANF outperforms 90.91% of its industry peers.
- ANF's Return On Equity of 39.43% is amongst the best of the industry. ANF outperforms 87.60% of its industry peers.
- The Return On Invested Capital of ANF (22.51%) is better than 89.26% of its industry peers.
- The last Return On Invested Capital (22.51%) for ANF is above the 3 year average (12.86%), which is a sign of increasing profitability.
- With an excellent Profit Margin value of 9.53%, ANF belongs to the best of the industry, outperforming 90.91% of the companies in the same industry.
- In the last couple of years the Profit Margin of ANF has grown nicely.
- ANF has a better Operating Margin (13.09%) than 90.91% of its industry peers.
- ANF's Operating Margin has improved in the last couple of years.
- ANF has a better Gross Margin (64.07%) than 94.21% of its industry peers.
Every day, new Affordable Growth stocks can be found on ChartMill in our Affordable Growth screener.
Our latest full fundamental report of ANF contains the most current fundamental analsysis.
Disclaimer
This article should in no way be interpreted as advice. The article is based on the observed metrics at the time of writing, but you should always make your own analysis and trade or invest at your own responsibility.
NYSE:ANF (2/19/2025, 3:00:15 PM)
105.72
-3.12 (-2.87%)
Find more stocks in the Stock Screener
ANF Latest News and Analysis
 2 days ago - ChartmillDespite its impressive fundamentals, NYSE:ANF remains undervalued.
Discover ABERCROMBIE & FITCH CO-CL A, an undervalued stock. NYSE:ANF showcases solid financial health and profitability while maintaining an appealing valuation.
 8 days ago - ChartmillInvestors seeking growth at a reasonable cost should explore NYSE:ANF.
ABERCROMBIE & FITCH CO-CL A could be undervalued. NYSE:ANF is scoring impressively in terms of growth while demonstrating strong financials. On top of that, it remains attractively priced.
