Don't overlook NYSE:ALSN—it's a hidden gem with strong fundamentals and an attractive price tag.
By Mill Chart
Last update: Feb 21, 2025
Our stock screening tool has identified ALLISON TRANSMISSION HOLDING (NYSE:ALSN) as an undervalued gem with strong fundamentals. NYSE:ALSN boasts decent financial health and profitability while maintaining an attractive price point. We'll break it down further.
Valuation Analysis for NYSE:ALSN
An integral part of ChartMill's stock analysis is the Valuation Rating, which spans from 0 to 10. This rating evaluates diverse valuation factors, including price to earnings and cash flows, while considering the stock's profitability and growth. NYSE:ALSN has received a 8 out of 10:
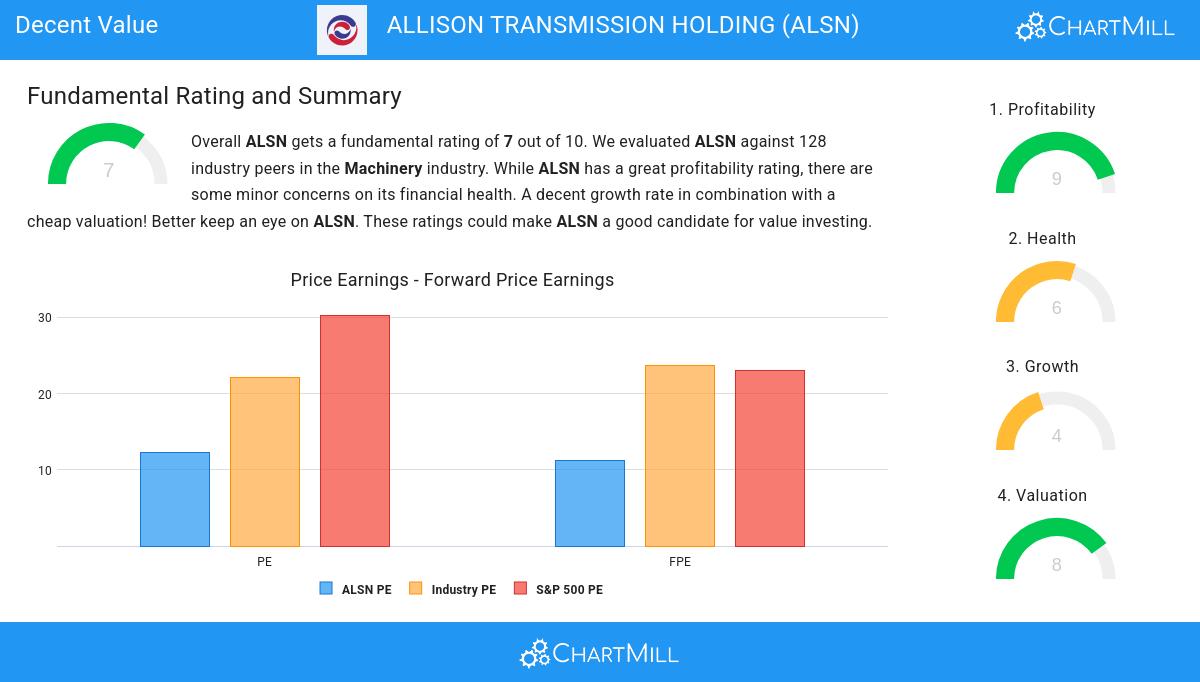
- Compared to the rest of the industry, the Price/Earnings ratio of ALSN indicates a rather cheap valuation: ALSN is cheaper than 85.60% of the companies listed in the same industry.
- ALSN's Price/Earnings ratio indicates a rather cheap valuation when compared to the S&P500 average which is at 30.30.
- With a Price/Forward Earnings ratio of 11.23, the valuation of ALSN can be described as very reasonable.
- Compared to the rest of the industry, the Price/Forward Earnings ratio of ALSN indicates a rather cheap valuation: ALSN is cheaper than 92.00% of the companies listed in the same industry.
- ALSN is valuated cheaply when we compare the Price/Forward Earnings ratio to 23.06, which is the current average of the S&P500 Index.
- Compared to the rest of the industry, the Enterprise Value to EBITDA ratio of ALSN indicates a somewhat cheap valuation: ALSN is cheaper than 80.00% of the companies listed in the same industry.
- Based on the Price/Free Cash Flow ratio, ALSN is valued cheaply inside the industry as 90.40% of the companies are valued more expensively.
- The excellent profitability rating of ALSN may justify a higher PE ratio.
- ALSN's earnings are expected to grow with 16.55% in the coming years. This may justify a more expensive valuation.
How do we evaluate the Profitability for NYSE:ALSN?
ChartMill employs its own Profitability Rating system for stock evaluation. This score, ranging from 0 to 10, is derived from an analysis of diverse profitability metrics and margins. In the case of NYSE:ALSN, the assigned 9 is noteworthy for profitability:
- ALSN's Return On Assets of 13.70% is amongst the best of the industry. ALSN outperforms 90.40% of its industry peers.
- Looking at the Return On Equity, with a value of 44.28%, ALSN belongs to the top of the industry, outperforming 95.20% of the companies in the same industry.
- The Return On Invested Capital of ALSN (16.73%) is better than 88.80% of its industry peers.
- Measured over the past 3 years, the Average Return On Invested Capital for ALSN is significantly above the industry average of 11.00%.
- The 3 year average ROIC (16.17%) for ALSN is below the current ROIC(16.73%), indicating increased profibility in the last year.
- Looking at the Profit Margin, with a value of 22.67%, ALSN belongs to the top of the industry, outperforming 97.60% of the companies in the same industry.
- With an excellent Operating Margin value of 30.76%, ALSN belongs to the best of the industry, outperforming 100.00% of the companies in the same industry.
- ALSN has a Gross Margin of 47.41%. This is amongst the best in the industry. ALSN outperforms 88.80% of its industry peers.
Understanding NYSE:ALSN's Health Score
A critical element of ChartMill's stock evaluation is the Health Rating, which spans from 0 to 10. This rating considers multiple health factors, including liquidity and solvency, both in absolute terms and relative to industry peers. NYSE:ALSN has received a 6 out of 10:
- ALSN has a debt to FCF ratio of 3.65. This is a good value and a sign of high solvency as ALSN would need 3.65 years to pay back of all of its debts.
- ALSN has a Current Ratio of 3.04. This indicates that ALSN is financially healthy and has no problem in meeting its short term obligations.
- ALSN has a better Current ratio (3.04) than 76.00% of its industry peers.
- ALSN has a Quick Ratio of 2.42. This indicates that ALSN is financially healthy and has no problem in meeting its short term obligations.
- The Quick ratio of ALSN (2.42) is better than 83.20% of its industry peers.
Evaluating Growth: NYSE:ALSN
ChartMill assigns a Growth Rating to each stock, ranging from 0 to 10. This rating is determined by analyzing different growth elements, including EPS and revenue growth, spanning both historical and future figures. In the case of NYSE:ALSN, the assigned 4 reflects its growth potential:
- The Earnings Per Share has grown by an nice 11.69% over the past year.
- The Earnings Per Share has been growing by 11.10% on average over the past years. This is quite good.
Our Decent Value screener lists more Decent Value stocks and is updated daily.
For an up to date full fundamental analysis you can check the fundamental report of ALSN
Keep in mind
This is not investing advice! The article highlights some of the observations at the time of writing, but you should always make your own analysis and invest based on your own insights.
102.36
-1.42 (-1.37%)
Find more stocks in the Stock Screener
ALSN Latest News and Analysis
 a minute ago - ChartmillDon't overlook NYSE:ALSN—it's a hidden gem with strong fundamentals and an attractive price tag.
Discover ALLISON TRANSMISSION HOLDING, an undervalued stock. NYSE:ALSN showcases solid financial health and profitability while maintaining an appealing valuation.
